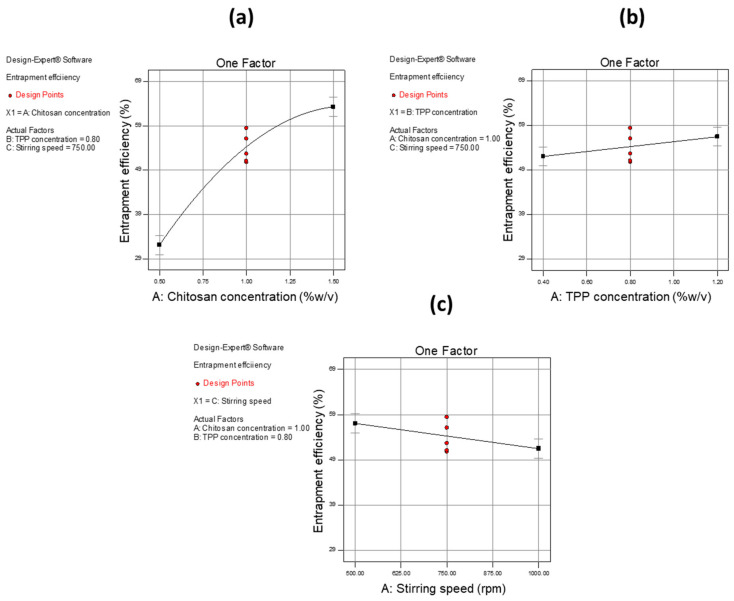
Figure 7.
One-factor plots of independent variables as well as their effect on the dependent variable (EE). (a) One-factor plot depicting the influence of concentration (% w/v) of CH on EE, (b) one-factor plot depicting the influence of concentration (% w/v) of TPP on EE, and (c) one-factor plot depicting the influence of stirring speed (rpm) on EE.

