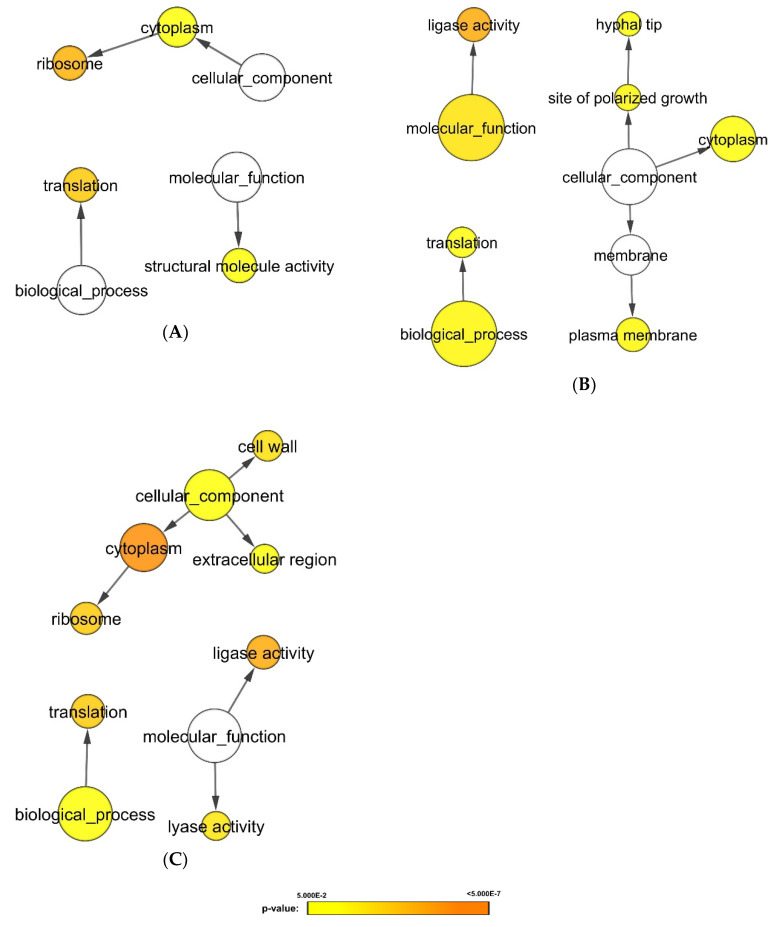
Figure 5.
Gene ontology analysis of proteins with higher expression in C. albicans biofilms when exposed to different groups of bacteria. Proteins extracted from 48 h mature biofilms were sent for label free mass spectrometry analysis. Differential expression analysis was first applied to determined biofilms’ proteins which were higher in each cluster. Subsequent gene ontology analysis illustrated biological processes which were significant higher in the C. albicans under bacterial stimulants: (A) Group 1: A. naeslundii, E. faecalis, and P. gingivalis; (B) group 3: S. mutans and S. sanguinis; (C) group 4: S. mitis and S. sobrinus (p-value < 0.05). The protein expression levels were represented in p-value using different colors: yellow (least significant) to orange (most significant). The white circles describe the 3 distinct aspects of how gene functions can be described: molecular function, cellular component, and biological process.

