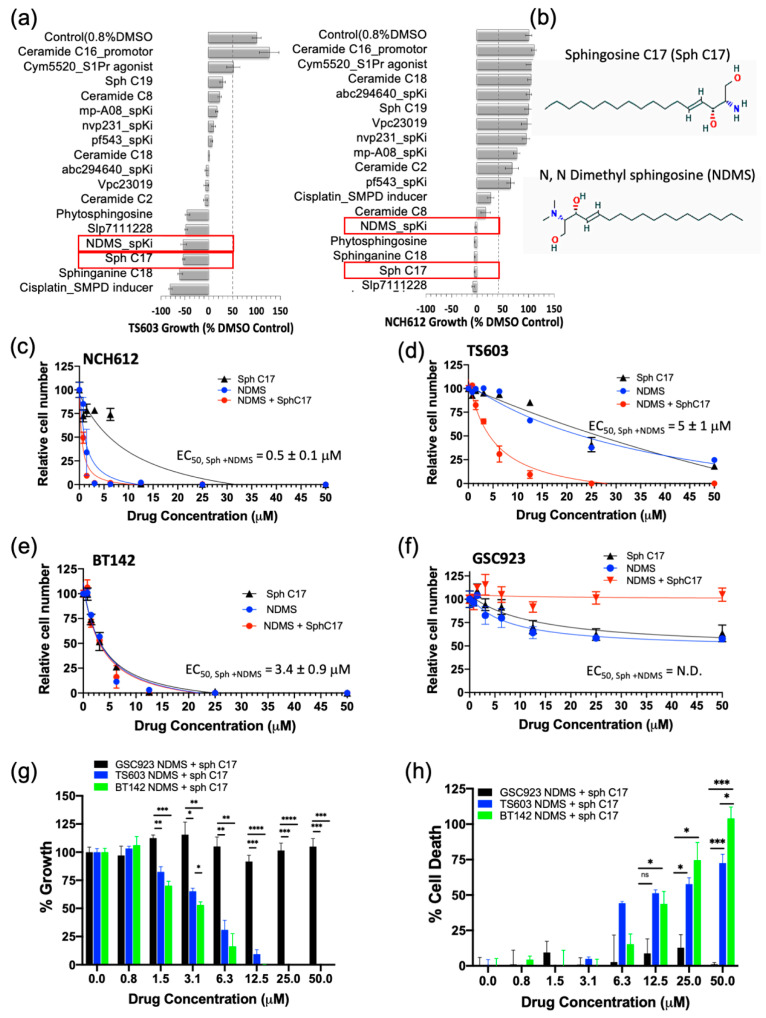
Figure 4.
Modulating the sphingolipid pathway induces IDHmut-specific cell death. (a) Rational drug screen to include 17 bioeffector molecules and inhibitors of sphingolipid pathway for two oligodendroglioma cell lines (TS603 and NCH612). Red rectangles highlight the molecules chosen to be analyzed further. (b) Chemical structures of the most active sphingolipids resulted from the screen sphingosine C17 and N, N dimethyl sphingosine. (c–f) EC50 measurements of three IDHmut glioma and one IDHWT glioblastoma cell line. The EC50 measurements were obtained via fitting to the equation from Graph Prism software. N.D, not determined. (g) Side-by-side comparison of growth rates between IDHWT (GSC923, black) and IDHmut (BT142, green; TS603, blue) cell lines treated with the drug combination of Sph C17 and NDMS. The data were obtained using a CCK8 assay described in the Methods section and plotted with Graph Prism 8.2.1. (h) Side-by-side comparison of percent cell death between IDHWT (black) and IDHmut cell lines (BT142, green; TS603, blue) treated with the drug combination of Sph C17 and NDMS. The data were obtained using a CCK12 assay described in the Methods section and plotted with Graph Prism 8.2.1. Statistical analysis (t-test) was conducted assuming equal variance, p-values are represented as follows: **** p < 0.00005, *** p < 0.0005; ** p < 0.005; * p < 0.05; ns, not significant. For simplicity, only significant values are shown on the graph.

