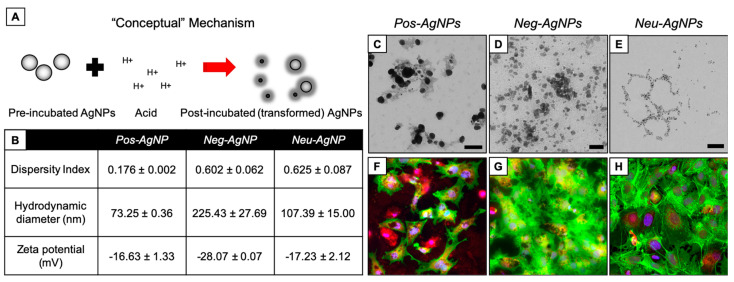
Figure 6.
AgNP transformation after incubation in acid. (A) Conceptual model of transformation mechanisms. (B) Dispersity index (unitless), hydrodynamic diameter (nm), and zeta potential (mV) measurements of each particle type after simulated incubation. TEM of (C) Pos–AgNPs, (D) Neg–AgNPs, and (E) Neu–AgNPs after simulated incubation. Fluorescence microscopy of HepG2 cells after 24 h exposure to post-incubated (F) Pos—AgNPs, (G) Neg–AgNPs, and (H) Neu–AgNPs. Scale bars in (C–E) represent 50 nm. Stains in (F–H) include DAPI (blue), F-actin (green), and MitoTracker (red).

