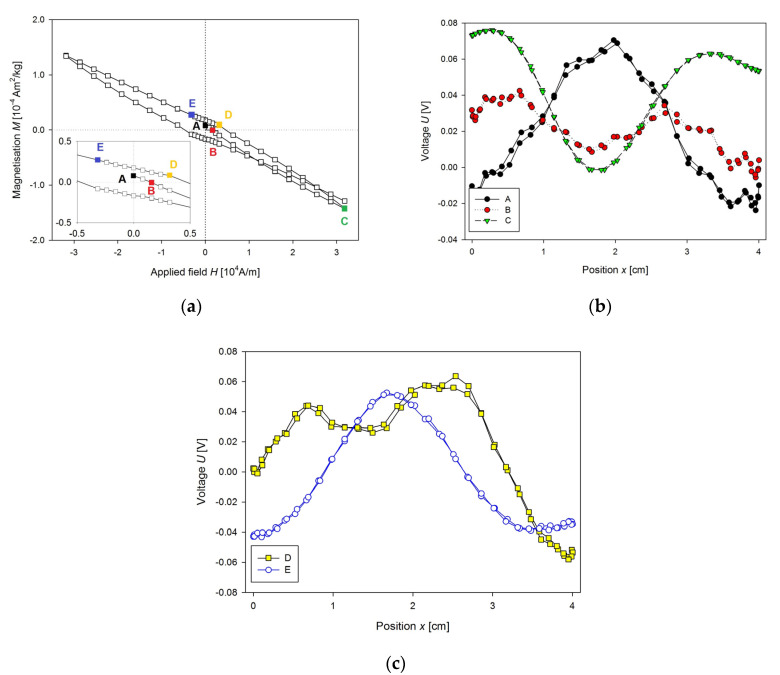
Figure 3.
(a) M(H) dependence of the fresh sample of the liver of Wistar-Kyoto (WKY) rat, (b) the voltage output of longitudinal SQUID scan for marked points (A–C) of the M(H) dependence presented in Figure 3a, (c) the voltage output of the longitudinal SQUID scan for marked points (D–E) of the MH dependence shown in Figure 3a.

