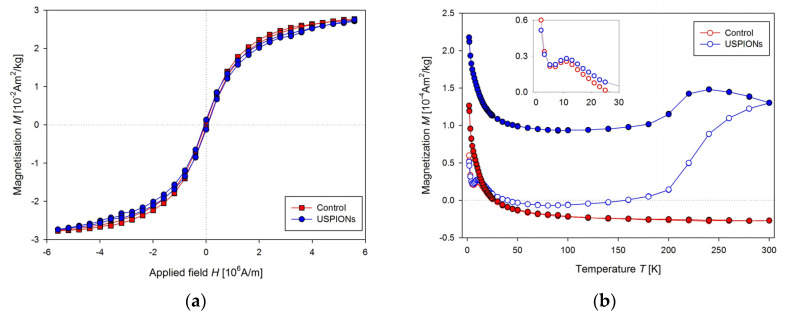
Figure 10.
Magnetic properties of the liver of control and USPION-treated rats. (a) The mass magnetisation vs. applied magnetic field measurement at a temperature of 2 K, (b) the mass magnetisation vs. the temperature at the applied magnetic field of 4000 A/m. The inset shows the peak at the ZFC (zero field cooled) curve both for control and USPIONs group. Curves are the average of 5 measurements per group.

