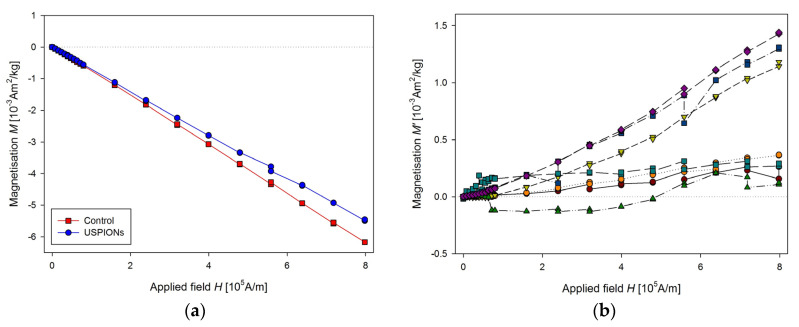
Figure 13.
Magnetic properties of the kidney of control and USPION-treated rats. (a) The partial M(H) dependences at 300 K, (b) corresponding M’ data for individual rats of the USPION-treated group after subtraction of the control group average. Data (a) are presented as the averaged curve from the control group (n = 6) and USPION-treated group (n = 7). The mass of dry samples was in the range of 3–6 mg. The smaller cutting tool was used (diameter of 3.5 mm).

