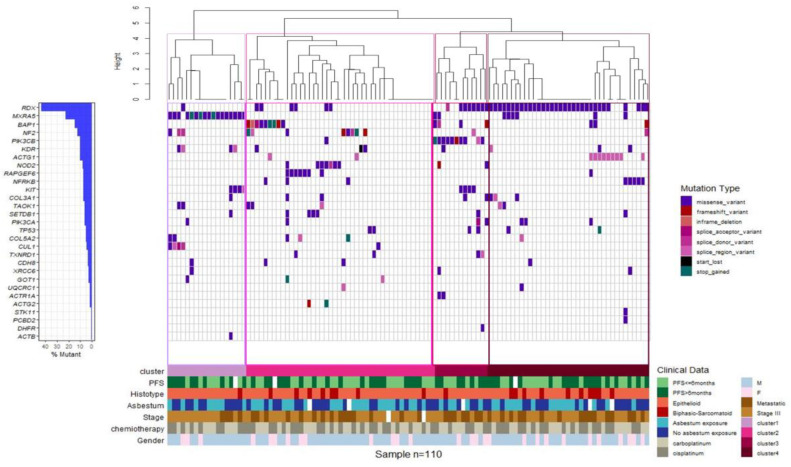
Figure 5.
Gene expression-based clustering shows four molecular subgroups. Clustering of MPM cases based on the mutational status. Waterfall plot summarizing the gene variants detected in each patient (columns). Colored squares indicate mutation types. Upper histograms represent for each patient the estimated number of mutations per MB, based on 90.875 bps covered by the panel. Colored line at the bottom indicates patients classified in different genetic clusters.

