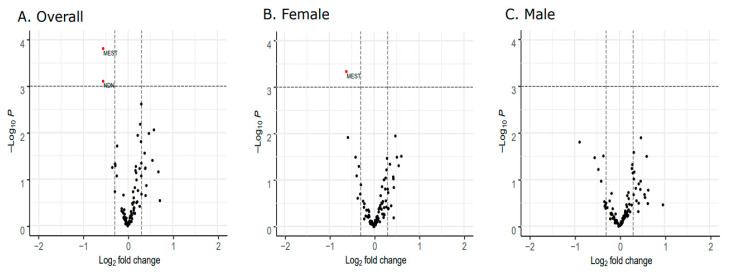
Figure 2.
Differential placental gene expression analyses between early onset cases and preterm controls. Volcano plots depict log2 fold change values between cases and controls on the x-axis and -log10 p-values on the y-axis. Points (in red) falling above the dashed horizontal line indicate genes that are significantly differentially expressed on the basis of an FDR <0.05. (A) Two genes, MEST and NDN, are significantly downregulated among cases compared to controls. In the sex-stratified analyses, MEST is also significantly downregulated comparing cases and controls within the female group (B). No significant difference in gene expression between cases and controls is observed within the male group (C).

