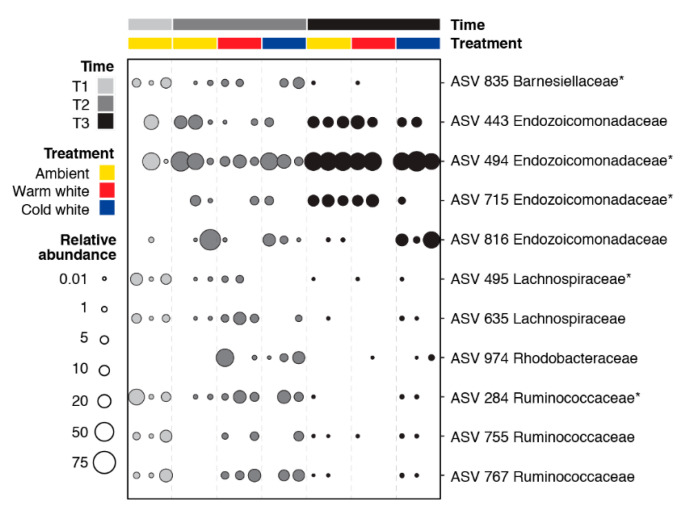
Figure 3.
Bubble plot showing the relative abundance of 11 differentially abundant ASVs in corals exposed to different light treatments and collected at different timepoints (T1, January; T2, February; and T3, March). Differentially abundant ASVs were identified using ALDEx2 with an effect size greater than |3|. ASVs with asterisks were also identified as bacterial indicator taxa using the indicspecies package (Figure S3).

