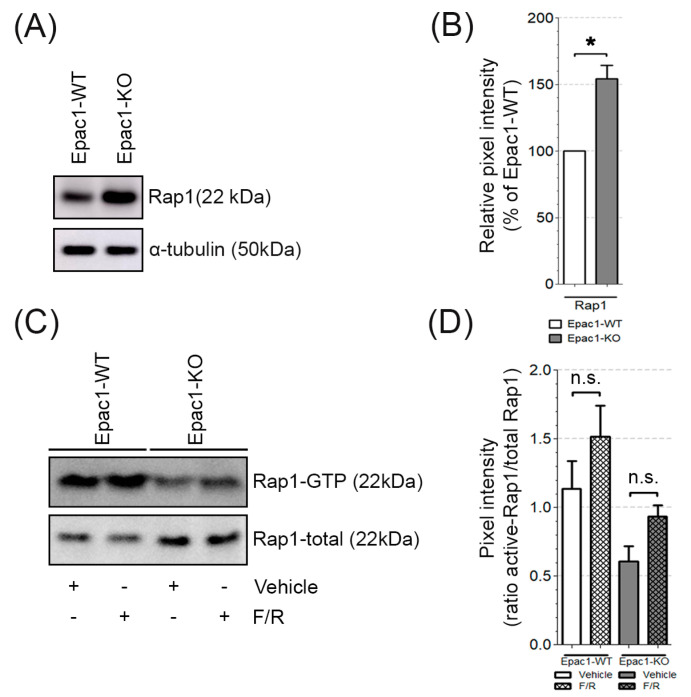
Figure 3.
Basal and GTP-bound levels of Rap1. (A) Representative Western blot of total Rap1; α-tubulin was used as a loading control. N = 5, n ≥ 2. (B) Relative expression of Rap1 in Epac1-KO was compared to the respective expression in WT cells; * p ≤ 0.05. (C) Rap1 activation in WT and Epac1-KO cells, treated with either vehicle (DMSO) or F/R. The activity of Rap1 was assessed by pulldown assays; N = 4. (D) Densitometric measurements from the Rap1-GTP pull-downs were normalized to the respective total Rap1. “n.s.” denotes non-significant differences.

