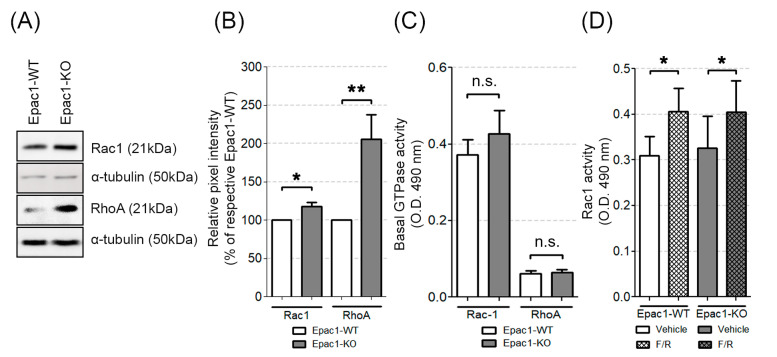
Figure 4.
Basal protein levels and activation state of the small GTPases Rac1 and RhoA. (A) Western blot analysis of whole cell lysates for Rac1 and RhoA. Equal loading validation was monitored with α-tubulin; N ≥ 10. (B) Respective densitometric measurements of the band intensity. (C) Activity levels of basal Rac1 and RhoA assessed by G-LISA in WT and Epac1-KO cell lines; N ≥ 9. (D) Rac1 G-LISA activity measured in either DMSO or F/R treated WT and Epac1-KO cell lines; N = 8; * p ≤ 0.05, ** p ≤ 0.01; “n.s.” denotes non-significant differences between the analyzed groups.

