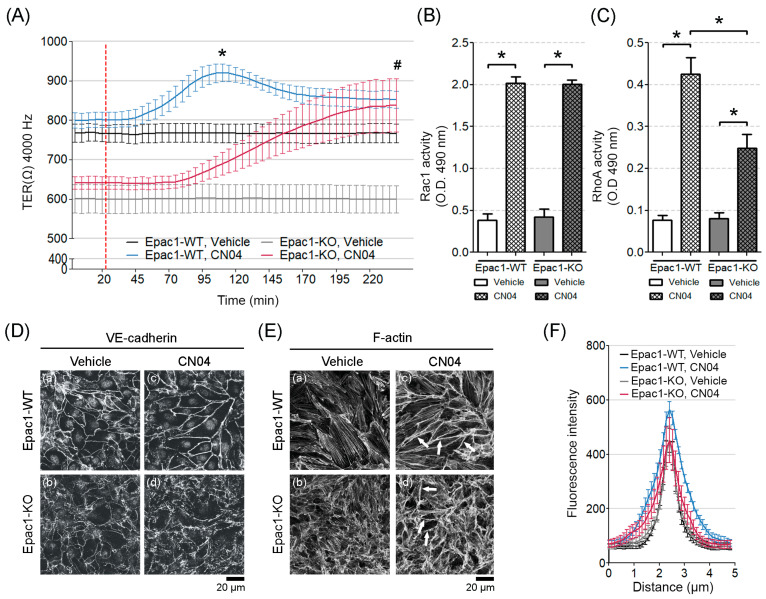
Figure 6.
Effects of simultaneous activation of Rac1 and RhoA on TER, GTPase activation, VE-cadherin and F-actin distribution. (A) After achieving a stable TER, the cells monolayers were administered with a CN04 mediator (segmented red line). Measurements for the respective controls were performed in parallel. Barrier resistance was monitored; N = 4–5, n ≥ 8; “*” denotes statistical significance for the WT-Vehicle vs. WT-CN04; “#” for the KO-Vehicle vs. KO-CN04. (B) Rac1 G-LISA activation assay in WT and the Epac1-KO cell lines subjected to DMSO or CN04; N = 7; * p ≤ 0.05. (C) RhoA G-LISA activation assay in the WT and KO cell lines exposed to DMSO or CN04; N = 6; * p ≤ 0.05. (D) VE-cadherin immunostaining from the confluent control (a and b) or the CN04-treated (c and d) cell monolayers; N = 4. (E) Effect of Rho GTPases on F-actin remodeling in the control (a and b) and the CN04-treated (c and d) confluent cell sheets. Arrows indicate cortical actin; N ≥ 4. (F) The intensity of VE-cadherin staining was quantified by densitometric measurements; N = 4; n ≥ 25 cells per N.

