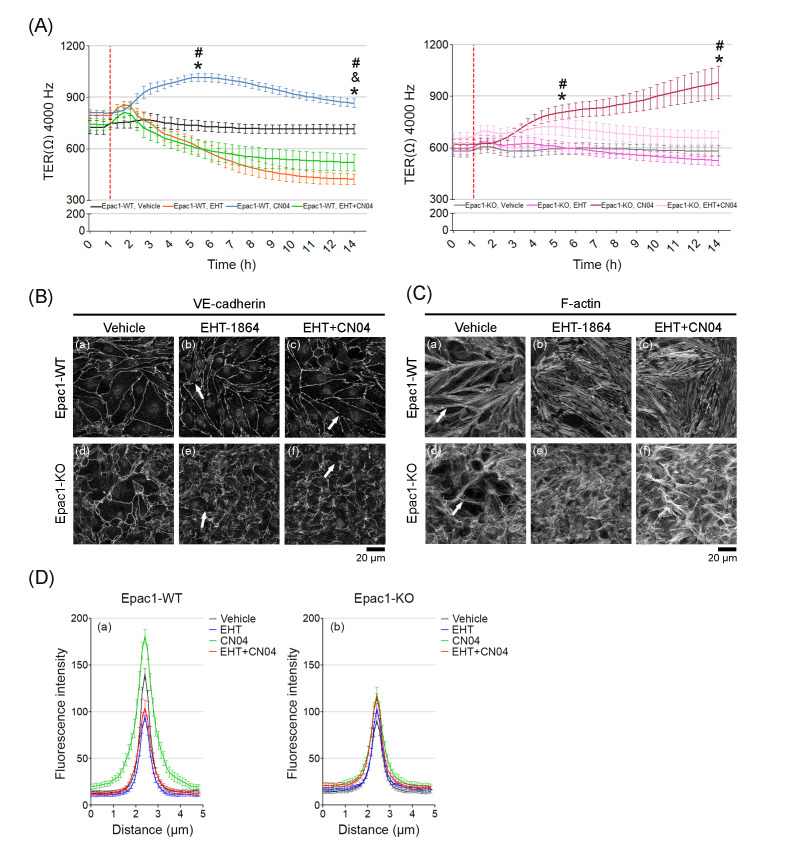
Figure 7.
Effects of Rac1 inhibition with EHT-1864 on TER, VE-cadherin, and F-actin. (A) Shows the barrier resistance (TER) of confluent WT or Epac1-KO endothelial cell monolayers during 14 h of incubation. After 1 h (segmented red line), the cells received either vehicle (H2O), EHT-1864, or CN04 alone, and EHT-1864 + CN04; N = 5; n = 10 for each condition, “*” shows significance for vehicle vs. the respective CN04 groups; “&” for vehicle vs. EHT-1864; “#” for CN04 vs. EHT-1864. (B) Shows VE-cadherin immunostaining of confluent WT and KO cell monolayers; N = 3 for each condition, given either vehicle (a and d), EHT-1864 (b and e), or EHT-1864 + CN04 (c and f). The arrows indicate the sites with disrupted VE-cadherin staining. (C) F-actin stained confluent cell sheets treated similar to panel B; N = 3. (D) The intensity of VE-cadherin staining from panel B was quantified by densitometric measurements, (a) for WT and (b) for the Epac1-KO cells; N = 3; n = 25 cells per N.

