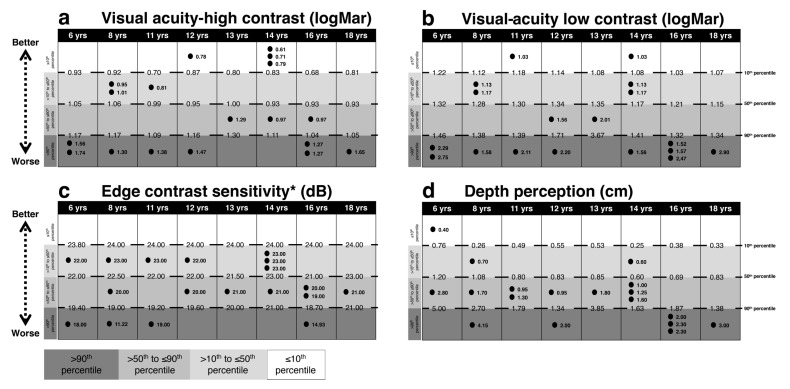
Figure 1.
Comparison between each ASD subject’s performance in the Physiological Profile Assessment (PPA) vision tests and age-matched reference values (percentiles) for typically developing (TD) subjects. Light gray to dark gray corresponds with better to worse performance. In (a) visual acuity high-contrast, in (b) visual acuity low-contrast, in (c) edge contrast sensitivity, in (d) depth perception. The reference value of the 10th, 50th and 90th percentiles and each ASD subject values are reported. Intervals for each performance represent: ≤10th, 10th < x ≤ 50th, 50th < x ≤ 90th, >90th percentile from the top to the bottom, respectively. Abbreviations: yrs, years; LogMar, minutes of arc; dB, decibel units; cm, centimeters. * indicates the percentile scale was inverted, i.e., for all items a score over the 90th percentile is an indicator of a worse performance.

