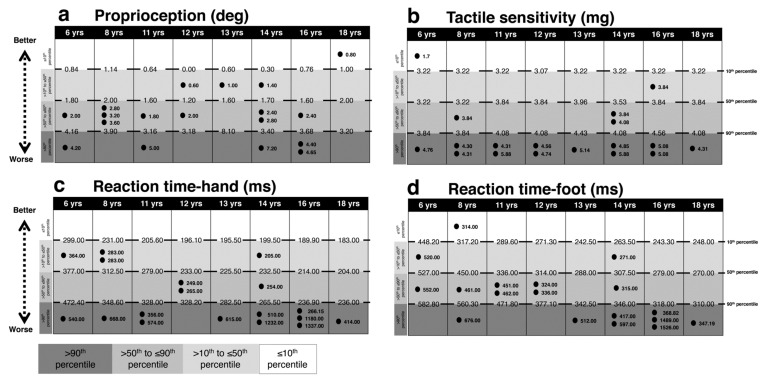
Figure 2.
Comparison between each ASD subject’s performance in the PPA peripheral sensation and reaction time tests and age-matched reference values (percentiles) for TD subjects. Light gray to dark gray corresponds with better to worse performance. In (a) proprioception, in (b) tactile sensitivity, in (c) reaction time on hand, in (d) reaction time on foot. The reference value of the 10th, 50th and 90th percentiles and each ASD subject values are reported. Intervals for each performance represent: ≤10th, 10th < x ≤ 50th, 50th < x ≤ 90th, >90th percentile from the top to the bottom, respectively. Abbreviations: yrs, years; deg, degree; mg, milligrams; ms, milliseconds.

