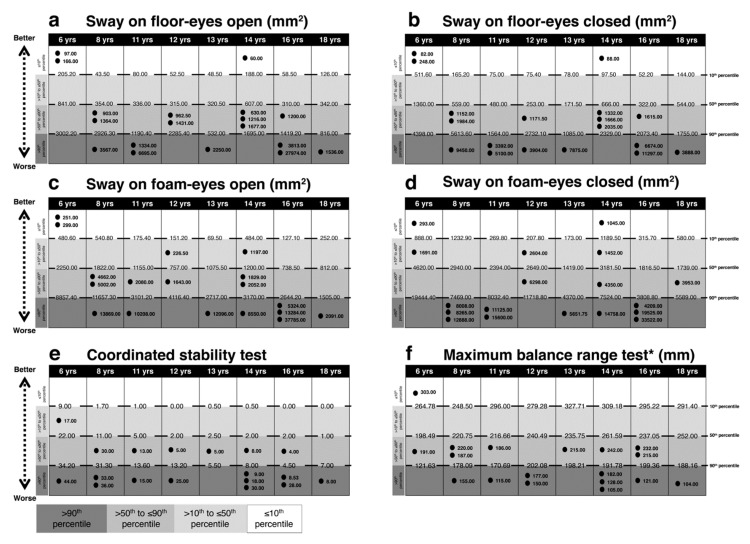
Figure 4.
Comparison between each ASD subject’s performance in the PPA balance tests and age-matched reference value (percentiles) for TD subjects. Light gray to dark gray corresponds with better to worse performance. In (a) sway on floor eyes open, in (b) sway on floor eyes closed, in (c) sway on foam eyes open, in (d) sway on foam eyes closed, in (e) coordinated stability test, in (f) maximum balance range test. The reference value of the 10th, 50th and 90th percentiles and each ASD subject values are reported. Intervals for each performance represent: ≤10th, 10th < x ≤ 50th, 50th < x ≤ 90th, >90th percentile from the top to the bottom, respectively. * indicates the percentile scale was inverted, i.e., for all items a score over the 90th percentile is an indicator of a worse performance. Abbreviations: yrs, years; mm2, millimeters square; mm, millimeters.

