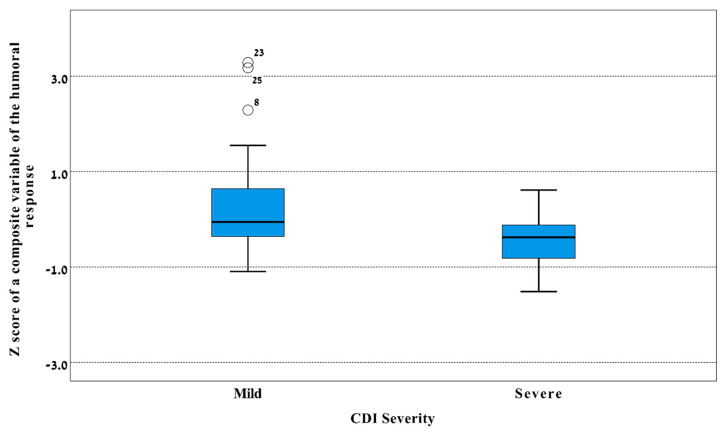
Figure 2.
Box plot of Z score of the humoral immune response against Clostridium difficile in patients with mild and severe CDI. A composite variable representing the humoral immune response was created using a factor analysis and it comprises serum IgG and IgA levels against toxin A and toxin B and expressed in Z scores (Y-axis). The line in the middle of the box represents the median level, lower bound of the box represents the 25th percentile, the upper bound of the box represents the 75th percentile, the lowest point of the lower whisker represents the minimum and the highest point of the upper represents the maximum. Black circles represent outliers. p = 0.026 by the Mann Whitney test for the difference between sever and mild CDI (X-axis) in the median level of this variable. CDI: Clostridium difficile infection; IgA: Immunoglobulin A; IgG: Immunoglobulin G.

