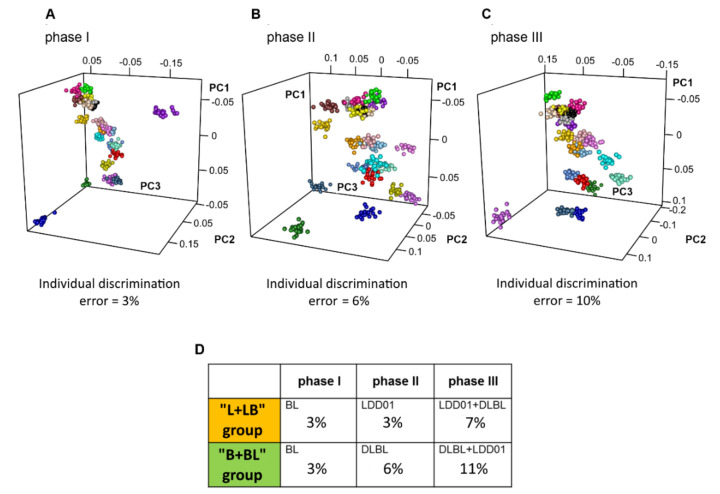
Figure 2.
Urinary individual metabolic phenotype of the volunteers in (A) phase I (B) phase II (C) phase III. The score plots of PCA-CA-KNN individual discrimination are reported: each color represents a different volunteer, while each dot of the same color represents a different urine sample belonging to the same volunteer. PRB01: aquamarine; PRB02: red; PRB04: deep pink; PRB06: yellow; PRB07: light sky blue; PRB09: green; PRB10: purple; PRB11: gray; PRB12: orange; PRB 13: black; PRB14: gold; PRB15: cornflower blue; PRB16: brown; PRB17: light pink; PRB18: medium blue; PRB21: salmon; PRB23: dark yellow; PRB24: steel blue; PRB26: orchid; PRB27: dark orchid; PRB28: cyan; PRB 29: forest green. (D) Values of individual discrimination errors (PCA-CA-KNN individual discrimination), for “L + LB” group and “B + BL” group, separately, in phase I, in phase II and in phase III.

