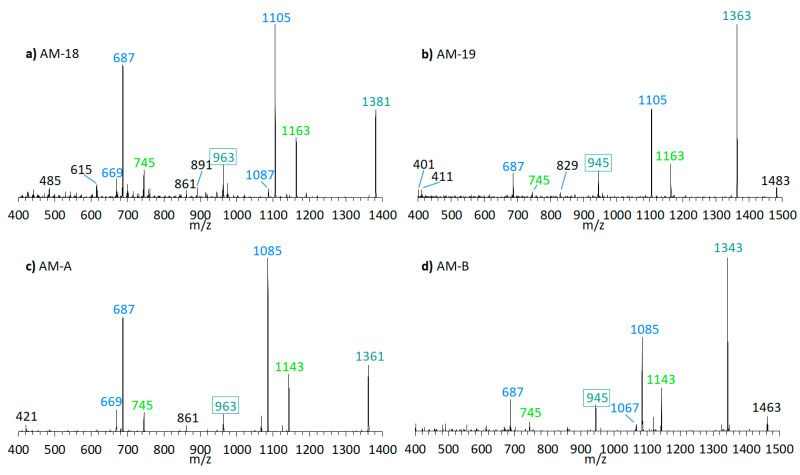
Figure 5.
CID-Spectra of detected AM, which only display low abundant fragments resulting from the C1′/C1 cleavage. (a) AM-18, tR = 2.71 min, strain CCMP1314; (b) AM-19, tR = 2.20 min, strain CCMP1314; (c) AM-A, tR = 2.76 min, strain DN241EHU (d) AM-B, tR = 2.27 min, strain DN241EHU. tR = retention time.

