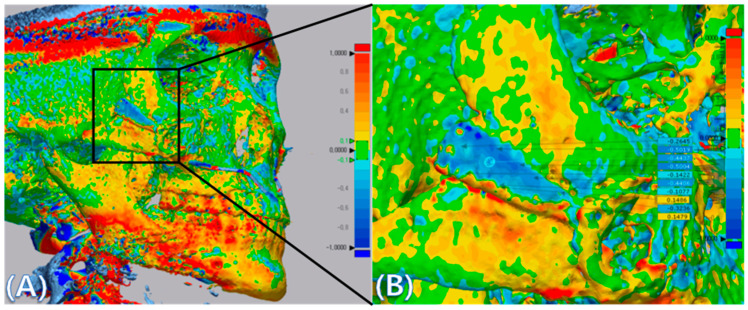
Figure 3.
(A) CT data were converted into stereolithography (STL) files and imported into Geomagic Control X, and superimposition of CT data taken immediate post surgery (reference data) and CT data taken at 6 months after surgery (measured data) was performed using the Geomagic Control X software. The images were positioned using both the Initial Alignment and Best-Fit Alignment tools. The colors show overlays of 2 CT scan data. (B) Deviations between reference data and measured data were measured at ten evenly spaced points on the implants. The specific values of deviation on the implants are demonstrated. The value of deviation across the entire scan is color-graded from 1 mm (blue) to +1 mm (red).

