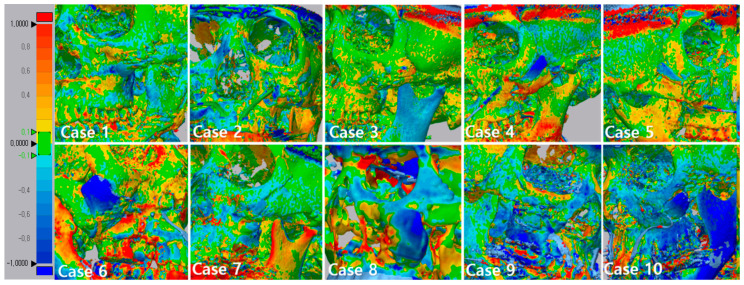
Figure 6.
3D comparison between immediately after surgery and after 6 months. This figure shows that the implant was attached closer to the surrounding bone. The specific values of deviation on the implants are demonstrated. The value of deviation across the entire scan is color-graded from 1 mm (blue) to +1 mm (red).

