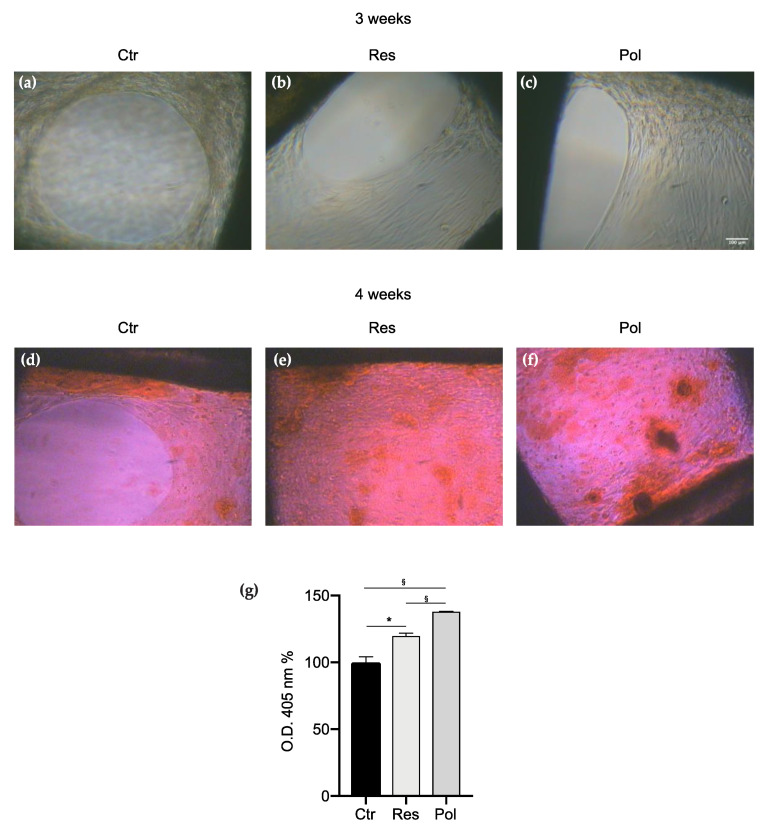
Figure 3.
DBSCs proliferation and mineral matrix deposition on medium pore scaffolds. (a–c) Representative phase contrast pictures of DBSCs treated with Res, Pol or Ctr for 21 days in osteogenic conditions on scaffolds presenting pores of medium dimensions (0.9 mm). Scale bar = 100 μm. (d–f) ARS (Alizarin red staining) displayed mineral matrix deposition by DBSCs after 28 days of culture. (g) The graph shows ARS quantification using the optical density (OD) as mean percentage ± SD and is representative for three independent experiments performed in quadruplicates. § p < 0.01, * p < 0.001. Student’s t-test was used for single comparisons. The biomaterial pores of a representative experiment were chosen for the figure.

