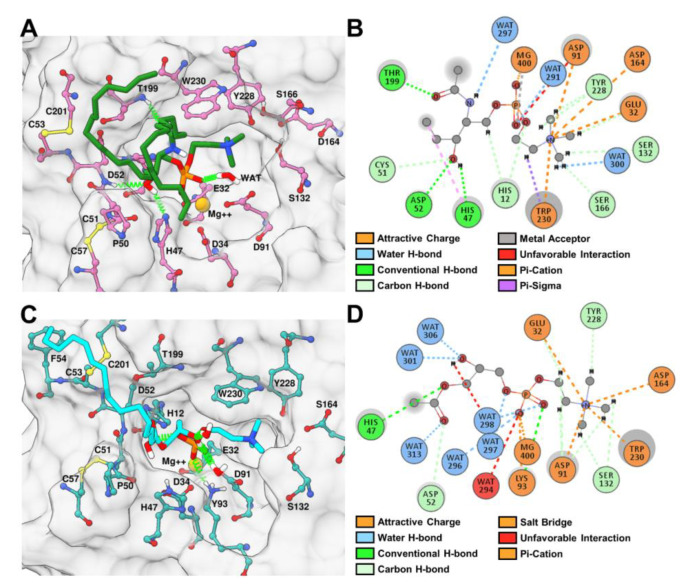
Figure 6.
Most sampled MD binding mode and interactions of SM and LPC with rRLiD1 and rHNC, respectively. (A) Position of SM (dark green) and the established hydrogen bond interactions (green springs) within the binding site residues of rLiD1. (B) 2D interaction map of the polar group of the most sample binding mode of SM in the rLiD1 simulation. (C) Position of LPC (cyan) and the formed hydrogen bond interactions (green springs) within the binding site residues of rHNC. (D) 2D interaction map of the polar group of the most sample binding mode of LPC in the rHNC simulation. The 3D surface figures were done with UCSF Chimera, while 2D maps were obtained with Discovery Studio Visualizer.

