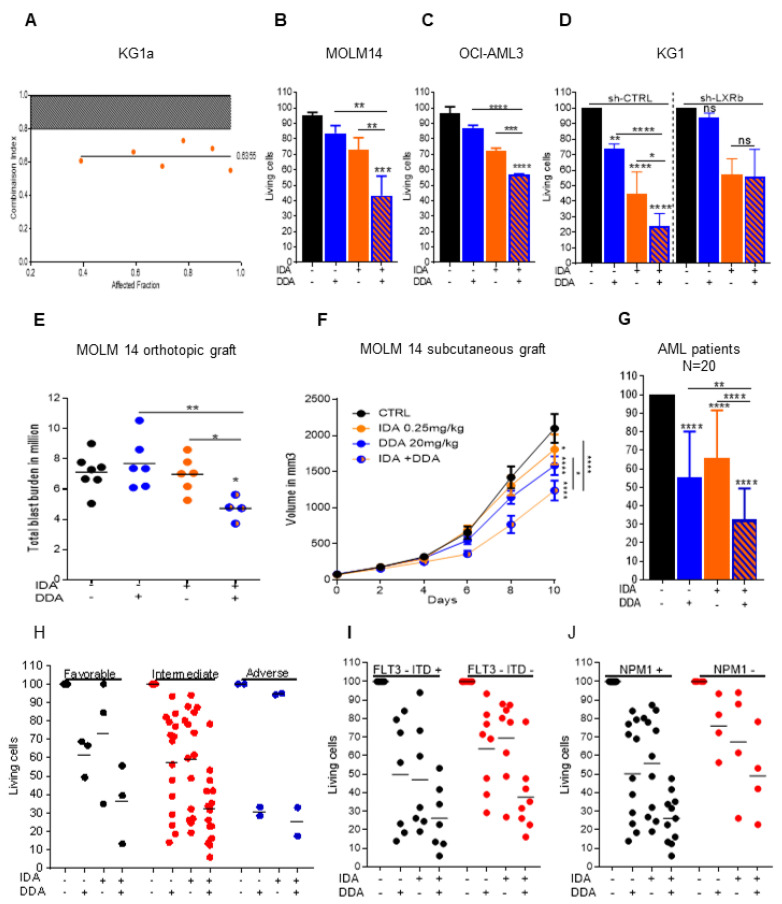
Figure 2.
Combined DDA and idarubicin synergistically induce the death of AML cells (A) Combination Index: CI < 0.80 indicates synergy of DDA with idarubicin in KG1a cells. (B,C) Cell death measurement by Trypan Blue exclusion test on MOLM-14 and OCI-AML3 cells treated for 48 h with DDA (2.5 µM), IDA at 25 nM for MOLM-14 and 50 nM for OCI-AML3 or both DDA and idarubicin at the same concentration. Bars are mean ± SD of 3 independent experiments. (D) Cell death measurement by flow cytometry on KG1-ShCTRL and KG1-ShLXRβ treated for 48 h with DDA (5 µM), IDA (50 nM) or both DDA and IDA (5 µM/50 nM). Data were represented as % of survival corresponding to annexin-V-/7AAD- cells relative to total cells. Bars are mean ± SD of 3 independent experiments. (E) Total tumor burden of MOLM14 orthotopically xenografted NSG mice were treated with DDA (20 mg/kg/day by i.p injection) or IDA (0.15 mg/kg/day every two days for 5 days by i.v injection) or both DDA and IDA or vehicle control. MOLM-14 leukemic cell burden in bone marrow and spleen was measured by flow cytometry using human anti-CD45, anti-CD45.1 and human anti-CD33 antibodies. (F) Tumor volume curve of MOLM14 xenografts (n= 15 per group) in NOD/SCID mice treated with DDA (20 mg/kg/day by i.p injection) or IDA (0.25 mg/kg/day every two days for 5 days by i.v injection) or both DDA and IDA or vehicle control. G-J) Samples from AML patients (n = 20) were treated with DDA (2.5 µM) or IDA (10 nM) or both DDA and IDA (2.5/10 nM) or vehicle for 48 h. Cell death was assessed in the leukemic bulk (CD45+) using annexinV/7AAD staining. Data were represented as % of survival corresponding to annexin-V-/7AAD- cells relative to total cells for all AML patients (G) or relative to their prognostic risk category (Low (LR), intermediate (IR), and high risks (HR)) (H) or according to FLT3-ITD (I) or NPM1 status (J). * p < 0.05, ** p < 0.01 and *** p < 0.001, **** p < 0.0001.

