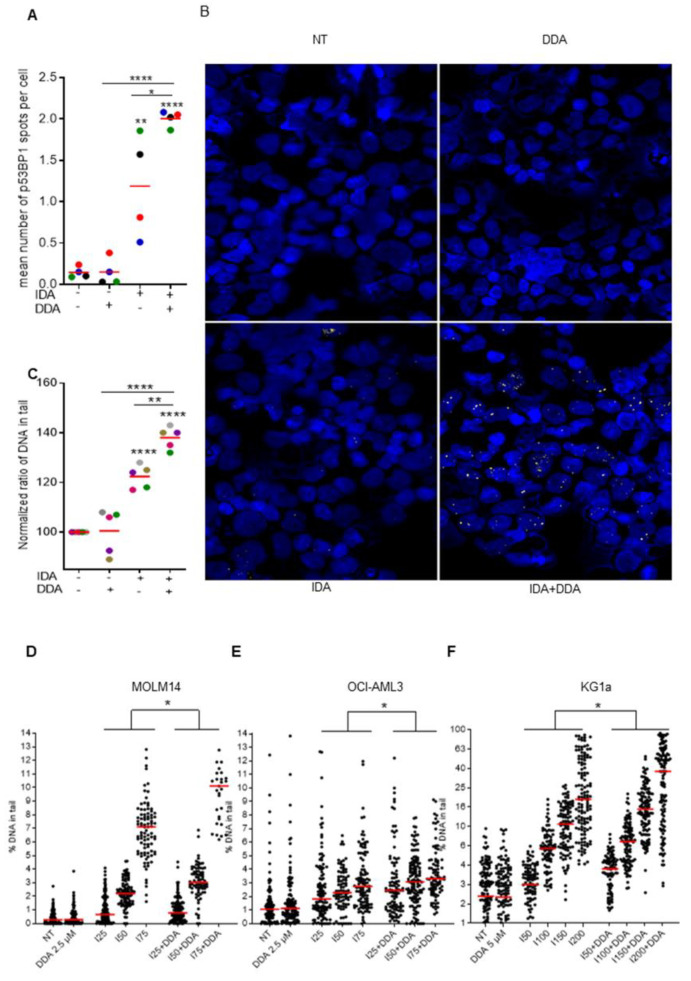
Figure 3.
DDA potentiates DNA damage due to idarubicin (A) Sample of AML patients (n = 4) were treated with DDA (2.5 µM) or IDA (10 nM) or both DDA and IDA (2.5/10 nM) or vehicle for 15 h and then analyzed in immunofluorescence. Data were represented as mean of p53BP1 spots per nuclei. (B) Representative images of primary AML cells. Nuclei are represented in blue and p53BP1 appear in red. (C) Sample of AML patients (n = 5) were treated with DDA (2.5 µM) or IDA (10 nM) or both DDA and IDA (2.5/10 nM) or vehicle for 15 h and then a standardize comet assay was performed. Data were represented as mean % of DNA in tail in cells relative to the vehicle-treated cells. (D–F) AML cell lines (MOLM14, OCI-AML3 and KG1a) were treated with vehicle, DDA (2.5 µM or 5 µM) or IDA at increase concentration or both DDA and IDA for 15 h and then a standardized comet assay was performed. Data were represented as % mean of DNA in tail in cells. Spots represent the % of DNA in tail in one single cell of 3 independent experiments. * p < 0.05, ** p < 0.01 and *** p < 0.001, **** p < 0.0001.

