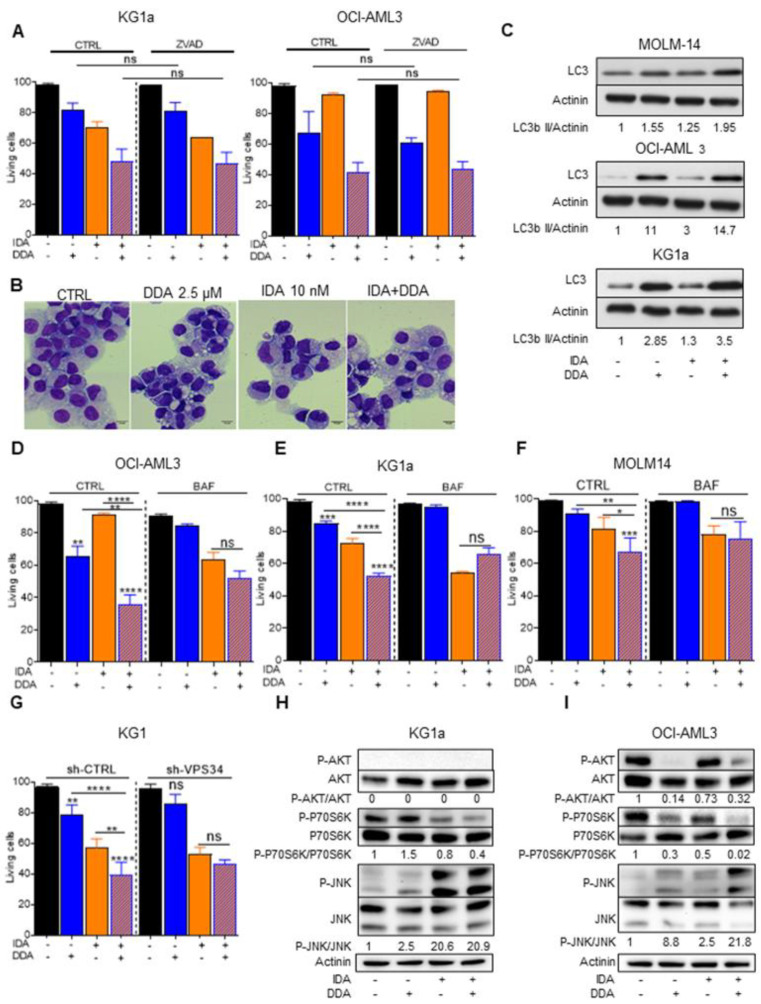
Figure 4.
Implication of autophagy after DDA–idarubicin (IDA) treatment (A) Cell death measurement by Trypan Blue exclusion test after caspase inhibition on KG1a and OCI-AML3 cells treated for 48 h with DDA, IDA or both DDA and IDA in the presence or absence of ZVAD-FMK (40 µM). Bars are mean ± SD of 3 independent experiments. (B) Representative images of primary AML cells stained with May Grumwald Giemsa after treatment with DDA (2.5 µM) or IDA (10 nM) or both DDA and IDA (2.5/10 nM) or vehicle. (C) Western blot analysis of the expression of LC3-b II in three AML cell lines (MOLM-14, OCI-AML3 and KG1a) treated 5 h with vehicle, DDA, IDA or both IDA and DDA. (D–F) Cell death measurement by Trypan Blue exclusion test after autophagy inhibition on OCI-AM3, KG1a and MOLM14 cells treated for 48 h with DDA, IDA or both DDA and IDA in the presence or absence of bafilomycin A1. Bars are mean ± SD of 3 independent experiments. (G) Cell death measurement by Trypan Blue exclusion test after autophagy inhibition on KG1 shVPS34 treated for 48 h with DDA, IDA or both DDA and IDA. Bars are mean ± SD of 3 independent experiments. (H,I) Western blot analysis of the expression of p-AKT, AKT, pP70S6K, P70S6K, JNK and pJNK in two AML cell lines KG1a and OCI-AML3) treated for 5 h with vehicle, DDA, IDA or both IDA and DDA. Detailed information can be found at Figure S3. * p < 0.05, ** p < 0.01 and *** p < 0.001, **** p < 0.0001.

