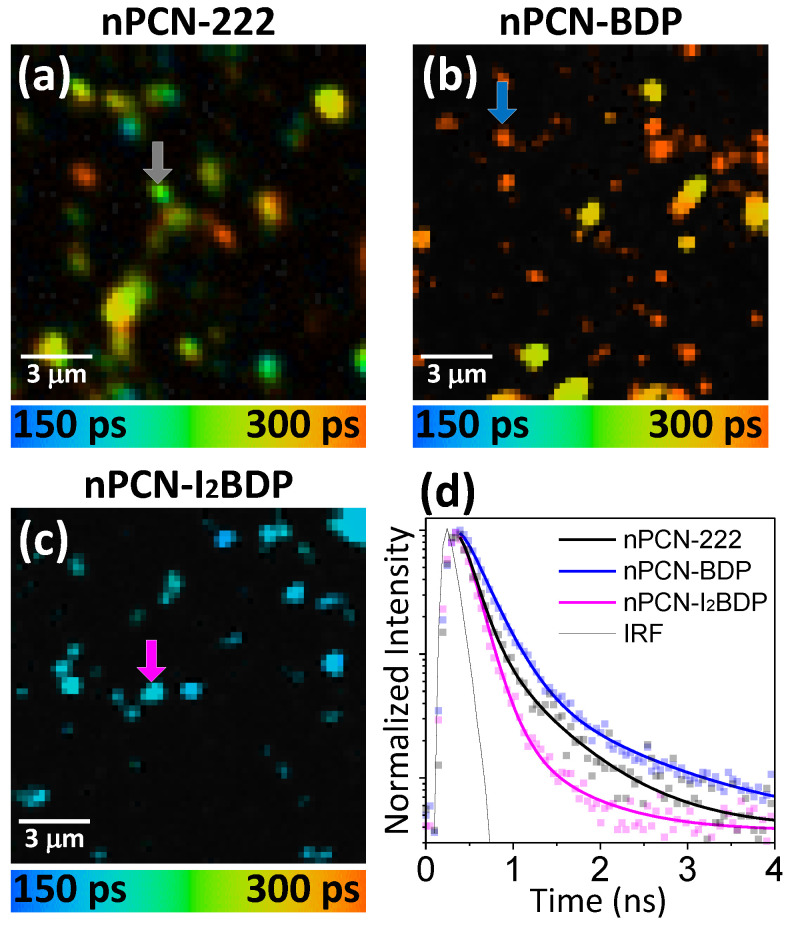
Figure 7.
(a) Fluorescence lifetime map of pristine nPCN-222 emission (630–750 nm) (same sample with Figure 5a. (b) Fluorescence lifetime map of acceptor emission of nPCN-BDP. (c) Fluorescence lifetime map of acceptor emission for nPCN-I2BDP. The spatial position of (b,c) is same with Figure 6a,c, respectively. (d) Representative fluorescence lifetime decay curves of acceptor emission obtained at the locations indicated by arrows in (a–c) that represent pristine nPCN-222 (Black), acceptor emission for nPCN-BDP (blue) and for nPCN-I2BDP (magenta).

