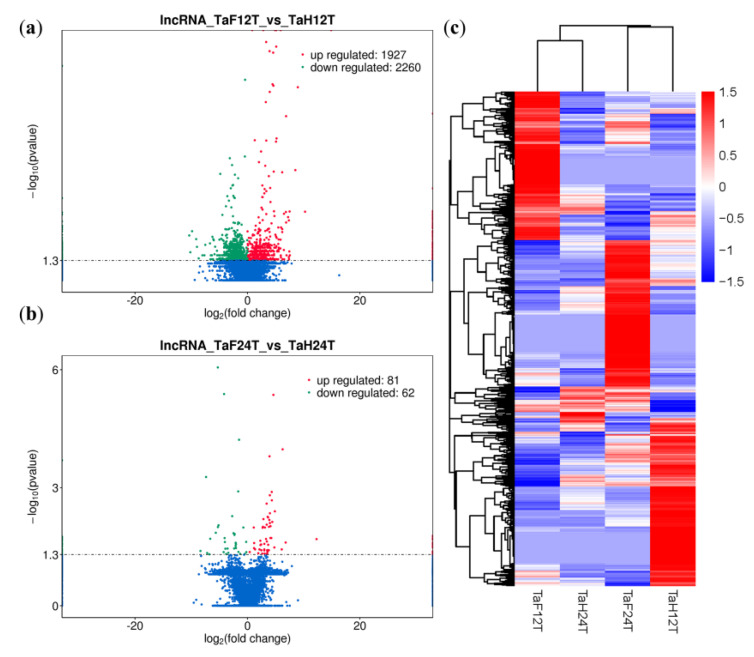
Figure 3.
Analysis of differentially expressed lncRNAs (DE lncRNAs) of wheat infected by F. graminearum. (a) Volcano plot of DE lncRNAs at 12 hpi. lncRNA_TaF12T_vs_TaH12T, wheat DE lncRNAs after 12 h inoculation with F. graminearum. The red and green points represent upregulated and downregulated lncRNAs, respectively. (b) Volcano plot of DE lncRNAs at 24 hpi. lncRNA_TaF24T_vs_TaH24T, wheat DE lncRNAs after 24 h inoculation with F. graminearum. (c) Hierarchical clustering plot of DE lncRNAs. TaF12T, samples at 12 h inoculation with F. graminearum; TaH12T, samples at 12 h inoculation with distilled water; TaF24T, samples at 24 h inoculation with F. graminearum; TaH24T, samples at 24 h inoculation with distilled water. Different columns represent different samples, and different rows represent different genes. Data are expressed as FPKM. Red: relatively high expression; Blue: relatively low expression.

