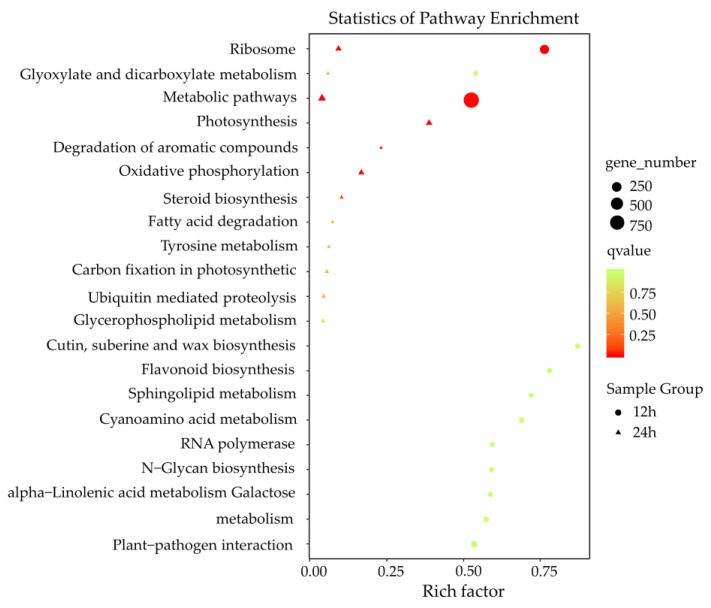
Figure 5.
KEGG enrichment analysis of putative target genes (PT genes) neighboring differentially expressed lncRNAs (DE lncRNAs). X-axis, the number of PT genes in each category to the ratio of total genes in that category. Y-axis, pathway terms. Round-shape, PT genes of the DE lncRNAs 12 h postinoculation. Triangle-shape, PT genes of the DE lncRNAs 24 h postinoculation. The number of genes in each pathway term was reflected by the size of the shapes. The significance of the enrichments is represented by the colors, where red represents a more significant enrichment than green.

