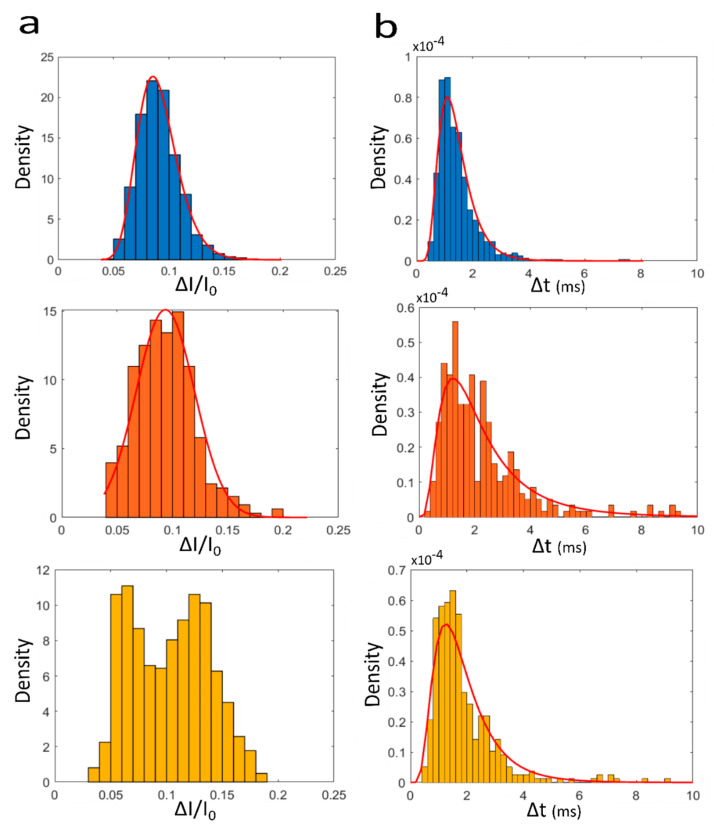
Figure 2.
Distribution histograms of (a) the amplitude of the relative current blockade (ΔI/I0) and (b) the dwell time (Δt) for the A10/T10 (blue), A40/T40: (orange), T40 (yellow). The events were recorded at 500 mV, the number of events n = 793, 332 and 634 for A10/T10, A40/T40 and T40, respectively. The results were obtained using pore 1 dt = 3 nm, db = 200 nm. The density (di) is the frequency (fi) of event relative to the sample size (n) and the bin width (wi) where wi = 0.01 and 200 for ΔI/I0 and Δt, respectively.

