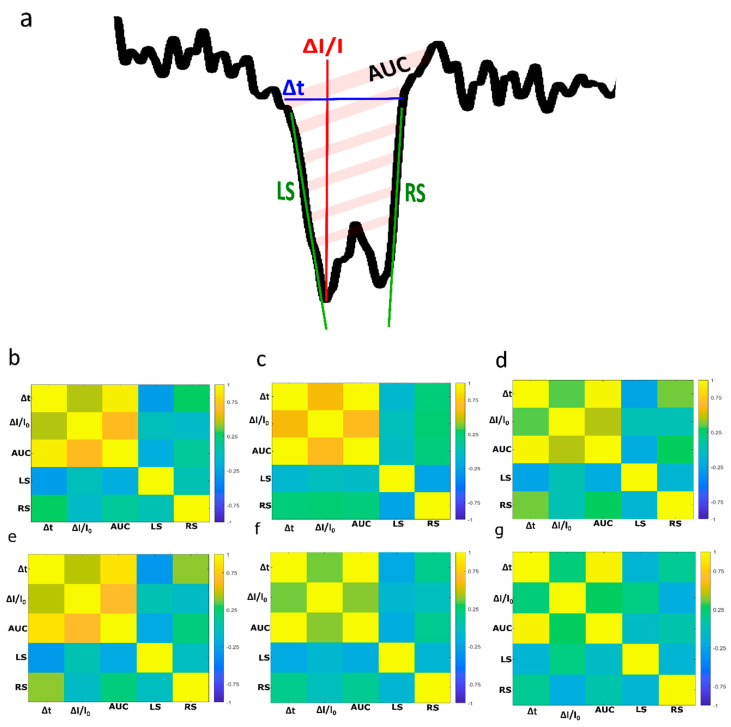
Figure 4.
(a) Zoom of a translocation event and the representation of variables characterizing events. (b–g) Heat map representing the correlation between the variables characterizing events obtained under 250 mV for (b) A10/T10, (c) A40/T40, (d) T40 and at 500 mV for (e) A10/T10, (f) A40/T40, (g) T40. The results were obtained using the pore dt = 3 nm, db = 200 nm.

