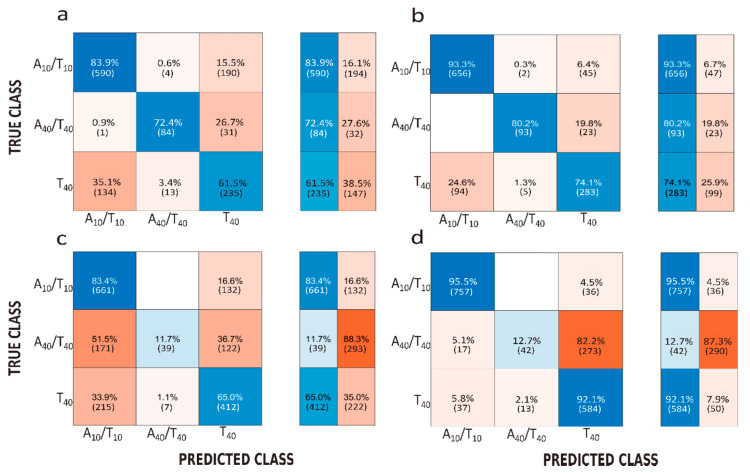
Figure 6.
Confusion matrices representing the accuracy of classification with the support vector machine approach obtained under V = 250 mV using (a) 2 features (ΔI/I0, Δt) and (b) 5 features (ΔI/I0, Δt, AUC, LS, RS) and under 500 mV using (c) 2 features (ΔI/I0, Δt) and (d) 5 features (ΔI/I0, Δt, AUC, LS, RS). The results were obtained using pore 1 dt = 3 nm, db = 200 nm.

