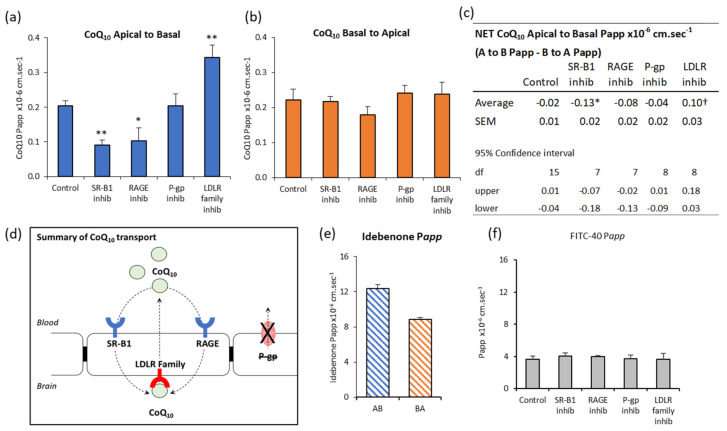
Figure 2.
Effect of inhibitors on CoQ10 transport across bEnd.3 BBB model. CoQ10 (pre-incubated in serum) transport across bEnd.3 cells on Transwell filters assayed over 60 min. Inhibitors added apically and basally two hours before assay were BLT-1 (10 µM) for SR-B1, FPS-ZM1 (1 µM) for RAGE, receptor-associated protein (RAP) (0.5 µM) for LRP-1/LDLR and verapamil (0.1 mM) for p-glycoprotein. Apparent permeability, Papp, shown for (a) Apical to Basal CoQ10 transport, (b) Basal to Apical CoQ10 transport. (c) The “net” transport of CoQ10 across bEnd.3 cells, calculated from the difference between A to B transport (blood-to-brain) and B to A transport (brain-to-blood). “Net” transport in control cells did not differ from zero (95% confidence interval). * Treatment with SR-B1 or RAGE inhibitors (BLT-1 10 µM, FPS-ZM1 1 µM) resulted in “net” −ve transport, i.e., “net” transport directed toward the blood side (B to A). † Treatment with LRP-1/LDLR inhibitor RAP (0.5 µM), resulted in “net” +ve transport toward the brain side (A to B). The p-glycoprotein efflux transport inhibitor Verapamil (0.1 mM) had no significant effect. (d) Schematic summary of CoQ10 transport across the BBB. No “net” CoQ10 entry toward brain side. Uptake by RAGE and SR-B1, is opposed by LRP-1/LDLR mediated removal to blood, a major impediment to brain entry of CoQ10. (e) Transport of the CoQ10 analogue, Idebenone (10 µM). Apical to basal transport exceeded basal to apical, meaning there was “net” transport toward the brain. n = 4-5, Values are mean ± SEM * p < 0.05. (f) FITC-40 Apical to Basal transport; n = 8 (control), n = 4–5 (interventions); values are mean ± SEM; * p < 0.05, ** p < 0.01; ANOVA single factor; post-hoc Bonferroni.

