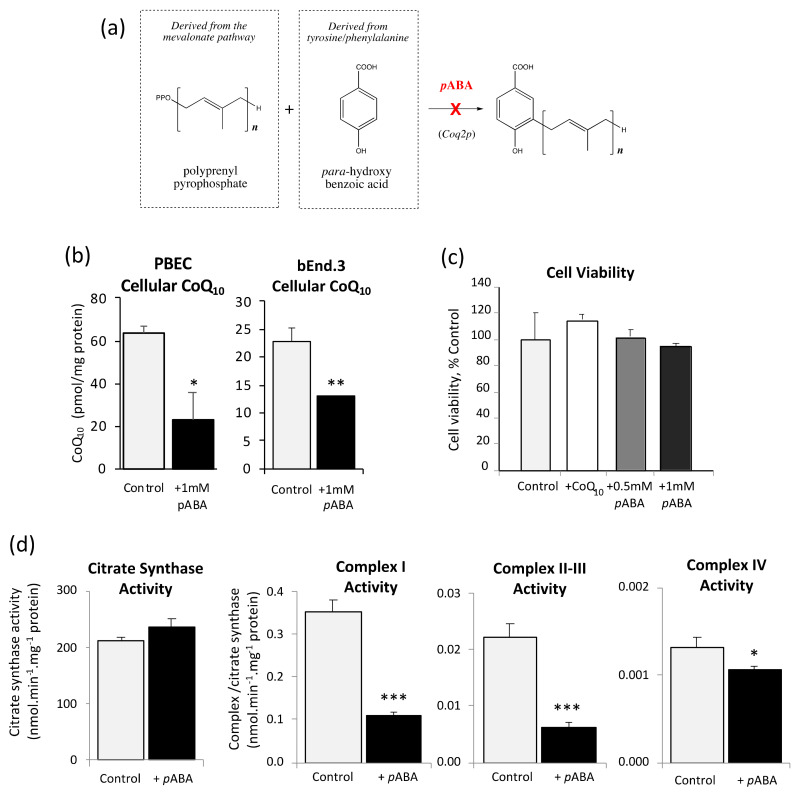
Figure 3.
Effect of pABA on cellular CoQ10 content, cell viability and mitochondrial respiratory chain (MRC) complexes. (a) Schematic showing pABA inhibition of CoQ10 synthesis. (b) PBEC and bEnd.3 cellular CoQ10 content after treatment with 1 mM pABA for 5 days (n = 4). (c) bEND.3 cell viability after 5 days treatment with CoQ10 (10 µM), or pABA 0.5 mM or 1 mM (n = 6). (d) Effect of 1 mM pABA treatment for 5 days on bEND.3 MRC complex I, II, III, and IV activity and citrate synthase (n = 4). Values are mean ± SEM; * p < 0.05, ** p < 0.01, *** p < 0.001 compared to control.

