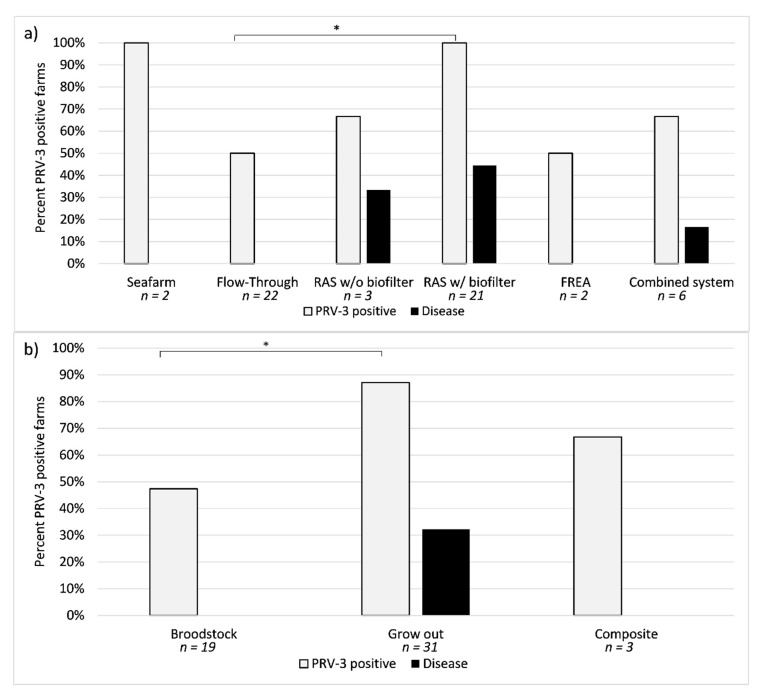
Figure 1.
On the y-axis percent PRV-3 positive farms; on the x-axis the categories investigated and the number of farms tested. If a farm has been tested multiple times with one test being positive for PRV-3, it is recorded as positive here. (a) Distribution of PRV-3 positive farms in relation to water recirculation intensity, and prevalence of disease associated with PRV-3. RAS w/o biofilter = RAS without biofilter (high exchange of water), RAS w/ biofilter = RAS with biofilter (low water exchange), FREA = Fully recirculated indoor aquaculture system, combined systems = farms that have both flow through and RAS. Prevalence of PRV-3 in flow through estimated to 0.500 (95% CI; 0.3072–0.6928), and in RAS w/ biofilters 1.000 (95% CI; 0.8241–1.000). (b) Distribution of PRV-3 positive farms according to the farm production type, and prevalence of disease associated with PRV-3. Prevalence of PRV-3 in broodstock farms estimated to 0.4737 (95% CI; 0.2733–0.6829), and in grow-out 0.8710 (95% CI; 0.7115–0.9487). * = p < 0.01.

