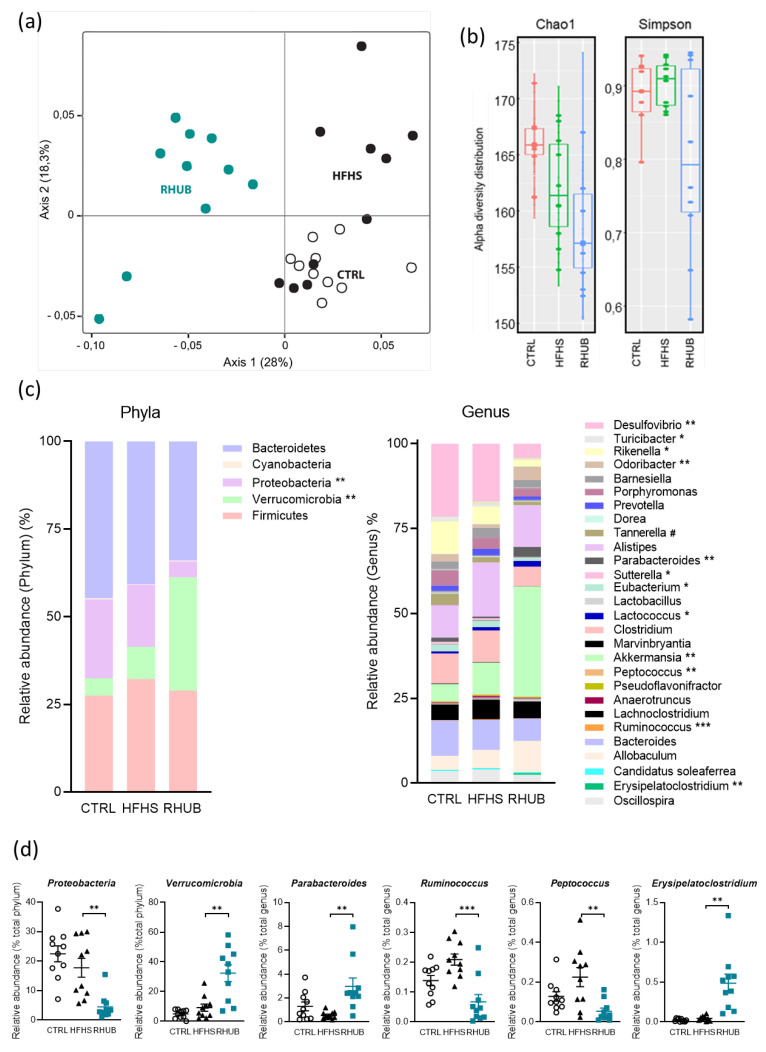
Figure 5.
Effects of rhubarb root extract on gut microbiota composition (a) Non-metric multidimensional scaling (MDS) representing the Jaccard-binary differences between individuals within each group. (b) Bacterial α-diversity from fecal microbiota. Bacterial richness (Chao1 index) is shown on the left; bacterial evenness (Simpson index) is shown on the right. (c) Relative abundance obtained by OTUs of the major bacterial phyla (left) and genera (right). (d) Relative abundance of specific bacterial phyla and genera in each sample among the CTRL, HFHS and RHUB group. (c,d) Kruskal-Wallis test with Dunn’s multiple comparison test. * p ≤ 0.05, ** p ≤ 0.01, *** p ≤ 0.005 for HFHS vs. RHUB; # p ≤ 0.05, ## p ≤ 0.01, ### p ≤ 0.005 for CTRL vs. HFHS.

