Figure 1.
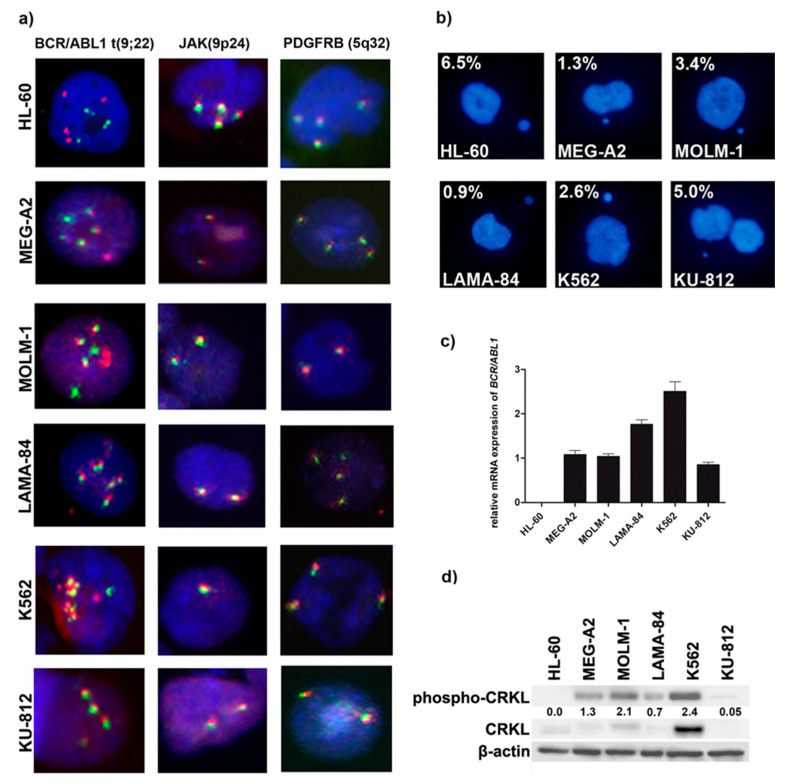
Cytogenetic and molecular features of BCR/ABL1-positive cell lines. (a) Representative images of fluorescence in situ hybridization with BCR-ABL1 t(9;22) fusion probe, JAK2 (9p24) break probe and PDGFRB (5q32) break probe. Fluorescent signals were visualized under the Olympus BX61 and MetaSystem Isis software with objective 40×; (b) Representative images and percentages of micronuclei (MN) positive cells expressed as %; (c) RT-qPCR analysis of BCR/ABL1 normalized to β2M and GUSB; (d) Assessment of BCR/ABL1 kinase activity, as determined by Western blotting analysis of phospho-CRKL. For the loading control, β-actin was used.

