Figure 2.
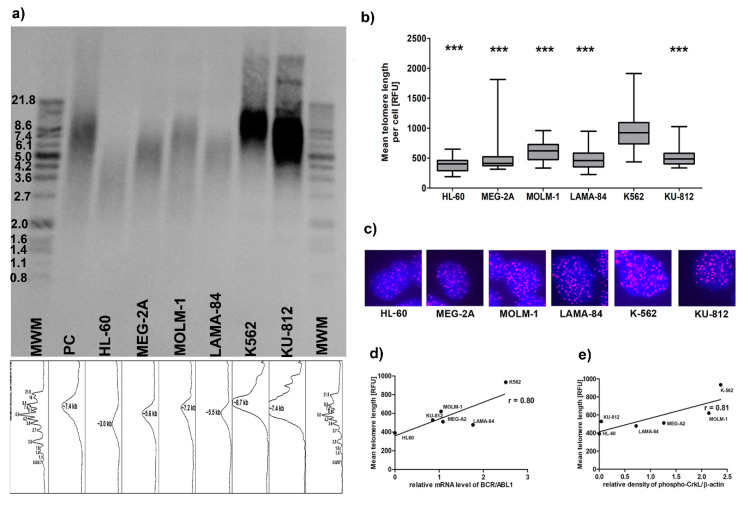
Telomere length dynamics in BCR/ABL1-positive cell lines. Global picture of telomere length: (a) Southern blot analysis of telomere length, MWM- molecular weight marker, PC-positive control; Mean TRF length for each cell line was estimated on the base of the highest signal intensity peak from TRF due to multiple hybridization of telomeric-specific hybridization probe. Densitometric profile was performed to correspond to bands of DNA marker using ImageJ with gel analysis module. (b) telomere length in a single cell: fluorescence in situ hybridization (FISH) with PNA technique. The bars indicate SD, n = 100, *** p < 0.001 compared to the K562 (ANOVA and Tukey’s a posteriori test); (c) Representative images of PNA. Fluorescent signals were visualized under the Olympus BX61 with objective 40×; (d,e) Telomere length positively correlates with BCR/ABL1 expression and activity: (d) Pearson’s (r) correlations of mean telomere length and BCR/ABL1 expression and (e) activity of BCR/ABL1 kinase expressed as relative density of phospho-CRKL normalized to β-actin.

