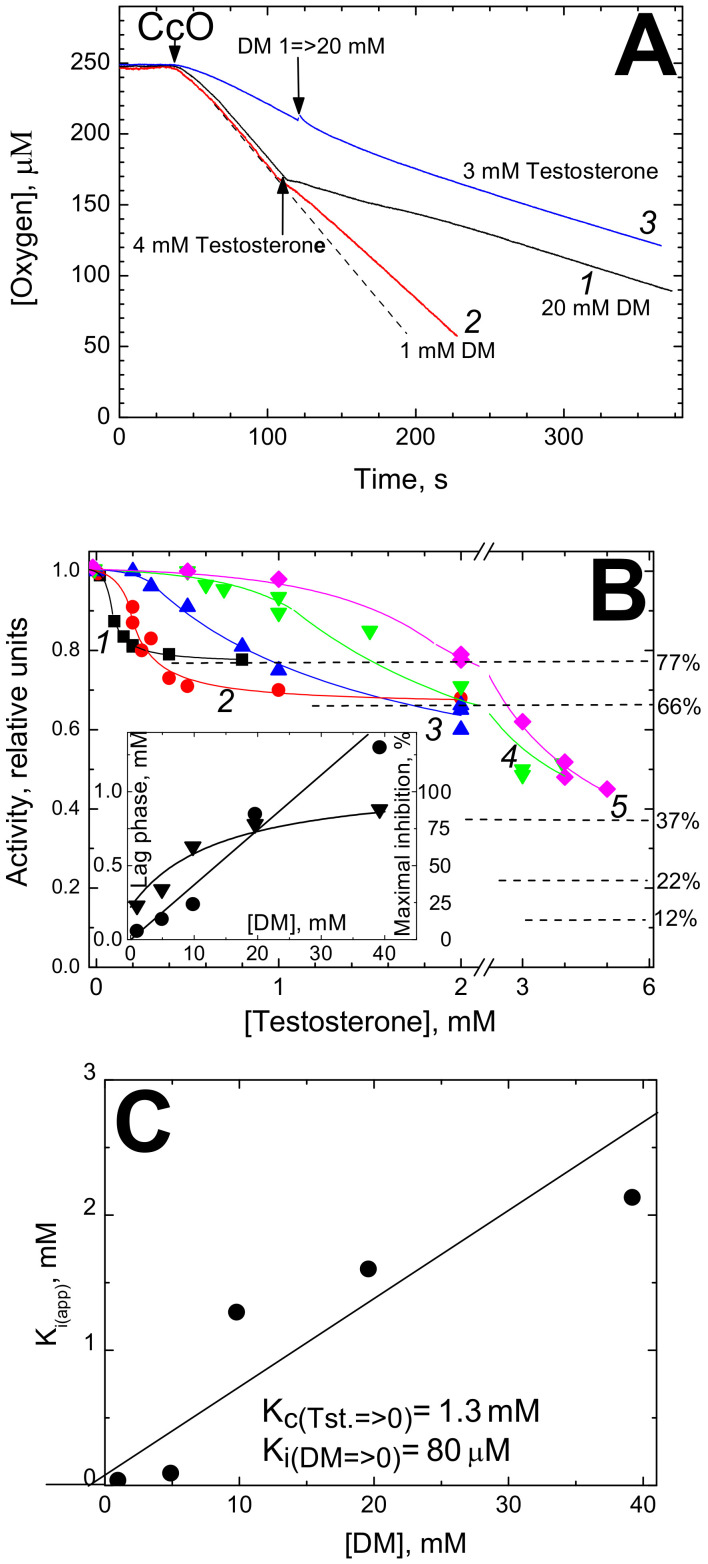
Figure 2.
Inhibition of cytochrome c oxidase activity by testosterone. (A) Oxygraph traces. Basic conditions as in Figure 1A. The initial DM concentrations are: trace 1 (black)—20 mM, traces 2 (red) and 3 (blue)—1 mM. Trace 3—the medium was also supplemented with 3 mM testosterone. Other additions are indicated by the arrows. The dashed straight line is drawn to visualize the effect of testosterone at 1 mM DM. (B) Titrations of CcO activity by testosterone at different concentrations of DM. The DM concentrations were: 1 (black squares)—1 mM; 2 (red circles)—5 mM; 3 (blue triangles)—10 mM; 4 (green triangles)—20 mM; 5 (magenta diamonds)—40 mM. Other conditions are mostly as in Figure 1B. Theoretical curves described by hyperbolic function (see the text) are drawn through the experimental points in the range of testosterone concentrations above the lag-phase value. For the lower concentrations of the inhibitor, the experimental points are connected by empirical lines simply to guide the eye. Dependences of the lag-phase length (filled circles, the left-hand Y axis) and of maximal inhibition level (filled triangles, the right-hand Y axis) on DM concentration are shown in the Inset. (C) Dependence of an apparent Ki for testosterone on DM concentration. The true value of Ki for testosterone (Tst.) in the absence of DM and Kc (dissociation constant) for DM in the absence of testosterone can be graphically determined as in the case of estradiol (see Figure 1C).

