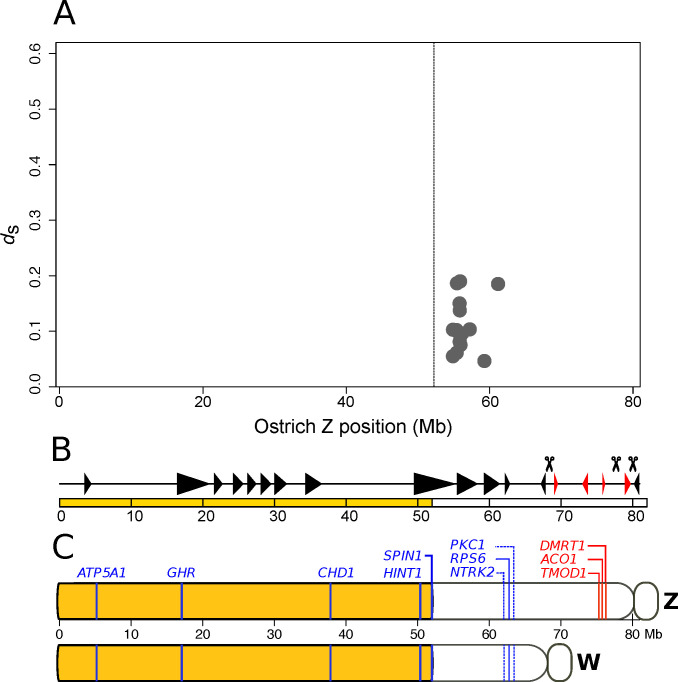
Figure 2.
Ostrich sex chromosome evolution. (A) Level of synonymous divergence of 16 gametologous genes in ostrich. ds estimates for gametologs are obtained from [36]. The vertical line indicates the boundary between the PAR (to the left) and the non-recombining region (to the right). (B) Illustration of inverted segments in the ostrich Z chromosome compared to the ancestral state in Neognathae. Red triangles indicate inverted segments and black triangles indicate parallel segments. Scissors represent inversion breakpoints. Figure from Yazdi and Ellegren [25], used under CC BY-NC 4.0 license. (C) Schematic representation of the order of genes mapped on Z and W chromosomes using cytogenetic methods [30] and here localized on the ostrich Z chromosome assembly of Yazdi and Ellegren [25]. PAR genes and gametologous genes in blue, hemizygous genes in red, and the yellow segment indicates the PAR.

