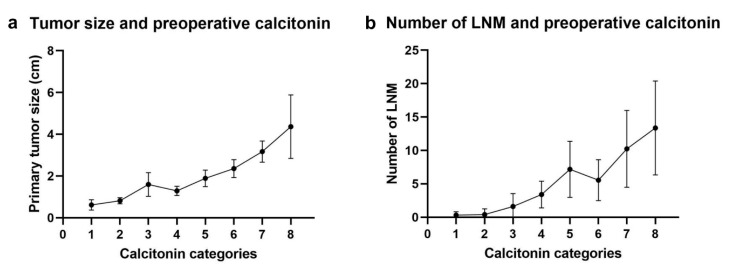
Figure 1.
Correlation between tumor extent and preoperative serum calcitonin levels. (a) Size of the primary tumor. (b) Number of LNMs (Calcitonin categories: category 1 (1–20 pg/mL), category 2 (20.1–100 pg/mL), category 3 (200.1–500 pg/mL), category 4 (200.1–500 pg/mL), category 5 (500.1–1000 pg/mL), category 6 (1000.1–2000 pg/mL), category 7 (2000.1–7000 pg/mL) and category 8 (more than 7000 pg/mL). The point represents the mean of the each category, and the error bars represent 95% confidential interval).

