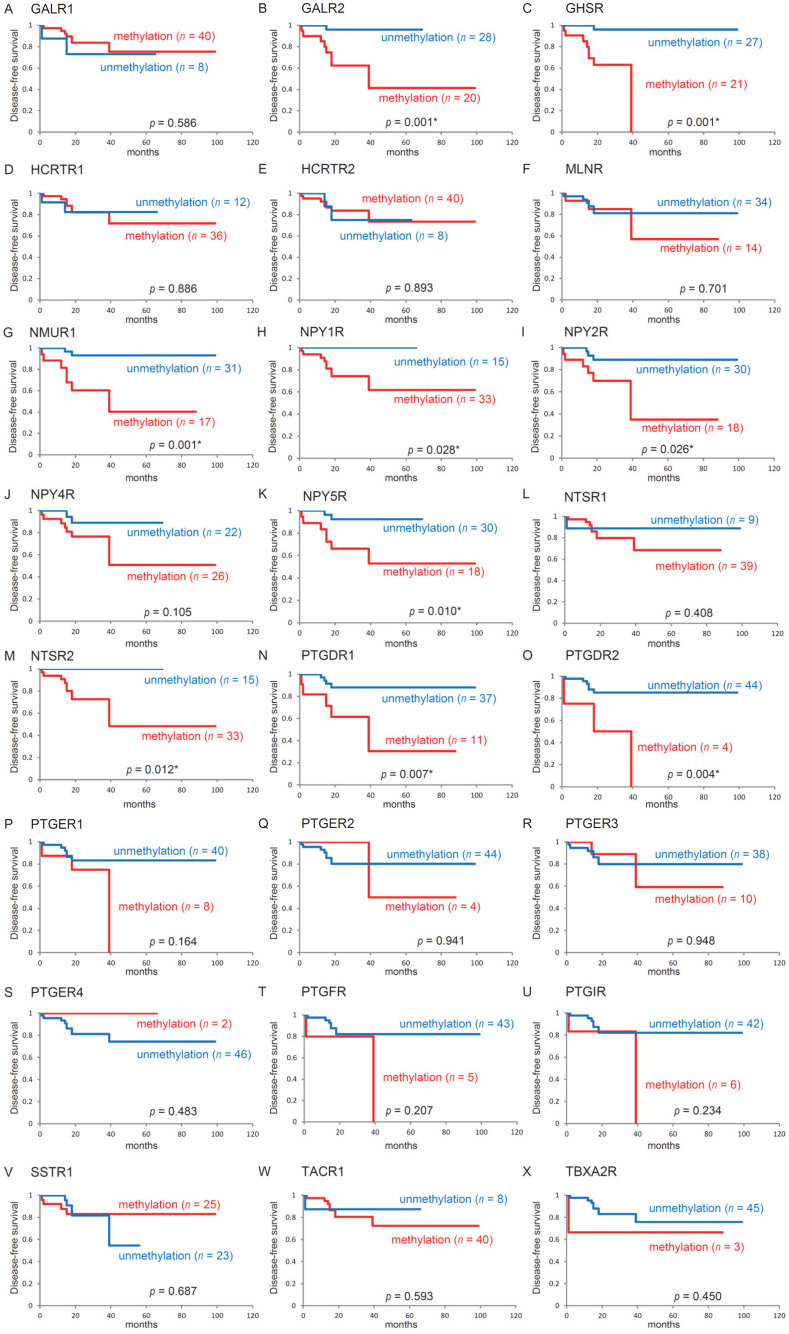
Figure 4.
Kaplan–Meier survival curves for 48 patients with HPV-associated oropharyngeal cancer according to the methylation statuses of 24 target genes disease free survival (DFS) for (A) GALR1, (B) GALR2, (C) GHSR, (D) HCRTR1, (E) HCRTR2, (F) MLNR, (G) NMUR1, (H) NPY1R, (I) NPY2R, (J) NPY4R, (K) NPY5R, (L) NTSR1, (M) NTSR2, (N) PTGDR1, (O) PTGDR2, (P) PTGER1, (Q) PTGER2, (R) PTGER3, (S) PTGER4, (T) PTGFR, (U) PTGIR, (V) SSTR1, (W) TACR1, and (X) TBXA2R for methylated (red lines) and unmethylated (blue lines) genes. A value of p < 0.05 has been considered statistically significant.

