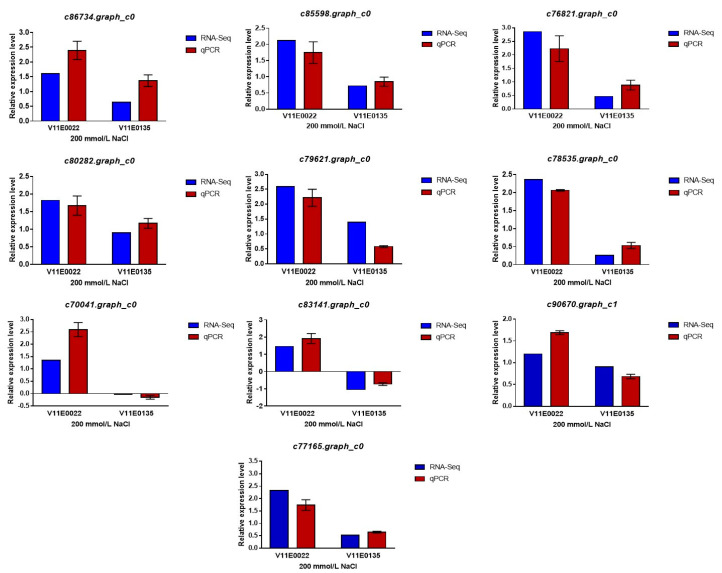
Figure 9.
qRT-PCR analyses of DEGs responses of two water dropwort cultivars to salt stress. The expression patterns of 10 candidate genes were measured by qRT-PCR and RNA-seq under salt stress treatment. Actin was used as internal control. The individual black bars, representing the qPCR data, are the means ± SD.

