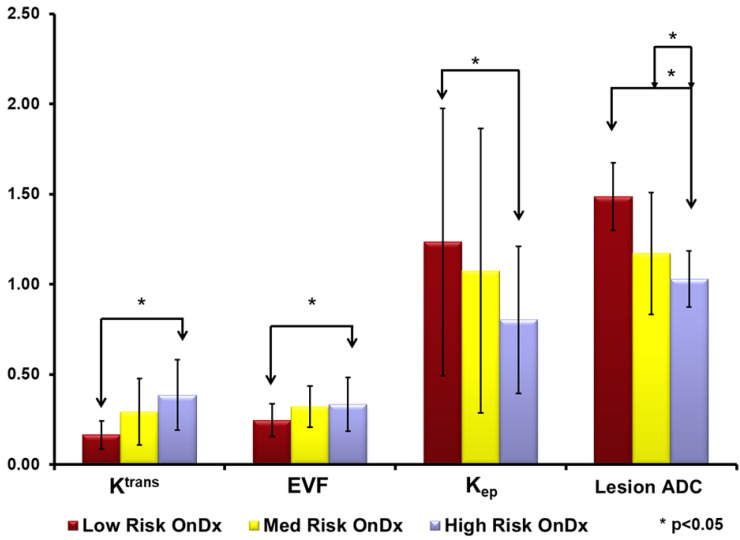
Figure 3.
Bar graphs of quantitative multiparametric MRI parameters for each risk group from the OncotypeDX (OnDx). There are significant differences between each group of patients in the apparent diffusion coefficient (ADC (×10−3 mm2/s)) of water and the Pharmacokinetic Dynamic Contrast Enhanced (PK-DCE) metrics. The PK-DCE metrics are the volume transfer constant (Ktrans (min−1)) and the fractional volume of the extracellular extravascular space (EVF (Ve)). * p < 0.05.

