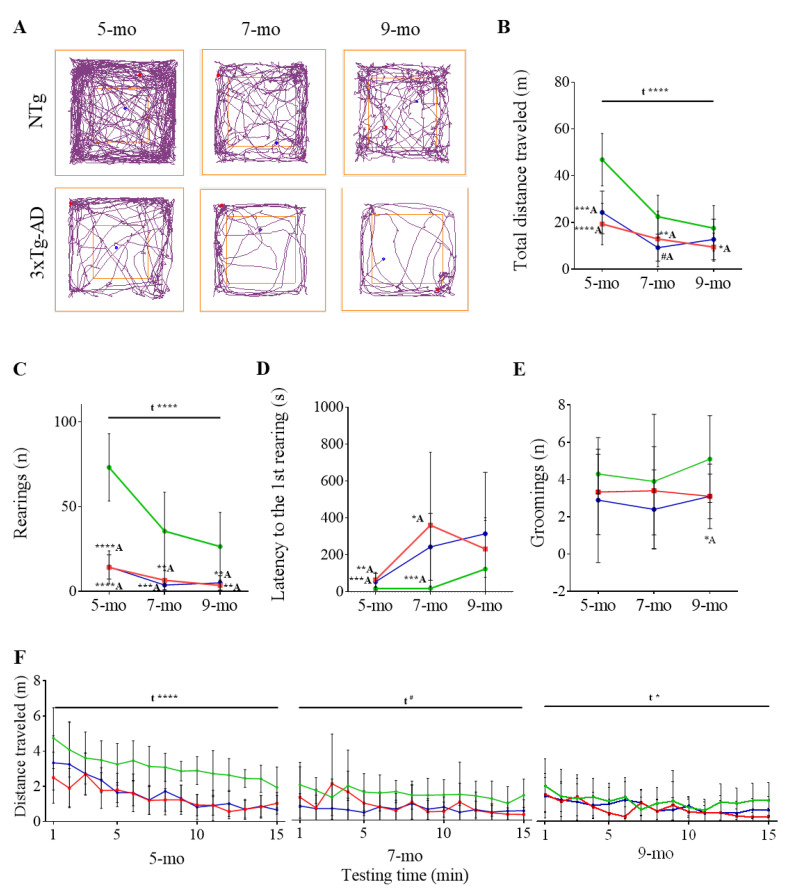
Figure 3.
BPSD-like symptoms as tested in the open-field test. (A) Track plots of the pathway followed by PBS-treated NTg and 3xTg-AD representative animals. The blue point indicates the animal location at the starting point and the red point the final location. (B–E) Evolution of NTg (green), 3xTg-AD (red), and scFv-h3D6-treated 3xTg-AD (blue) mice with age considering B) the distance travelled (m), (C) number of rearings, (D) latency to the first rearing (s), and (E) number of rearings. (F) Distance travelled over-time at different ages. Values are represented by means and error bands correspond to SD. # indicates a low, but not significant, p-value (0.05 < p ≤ 0.1) (Total distance travelled (m), 7-mo, NTg vs. 3xTg-AD-PBS, t = 2.022, p = 0.0583). * significant differences p ≤ 0.05, ** p ≤ 0.01, *** p ≤ 0.001, **** p ≤ 0.0001. A refers to NTg mice.

