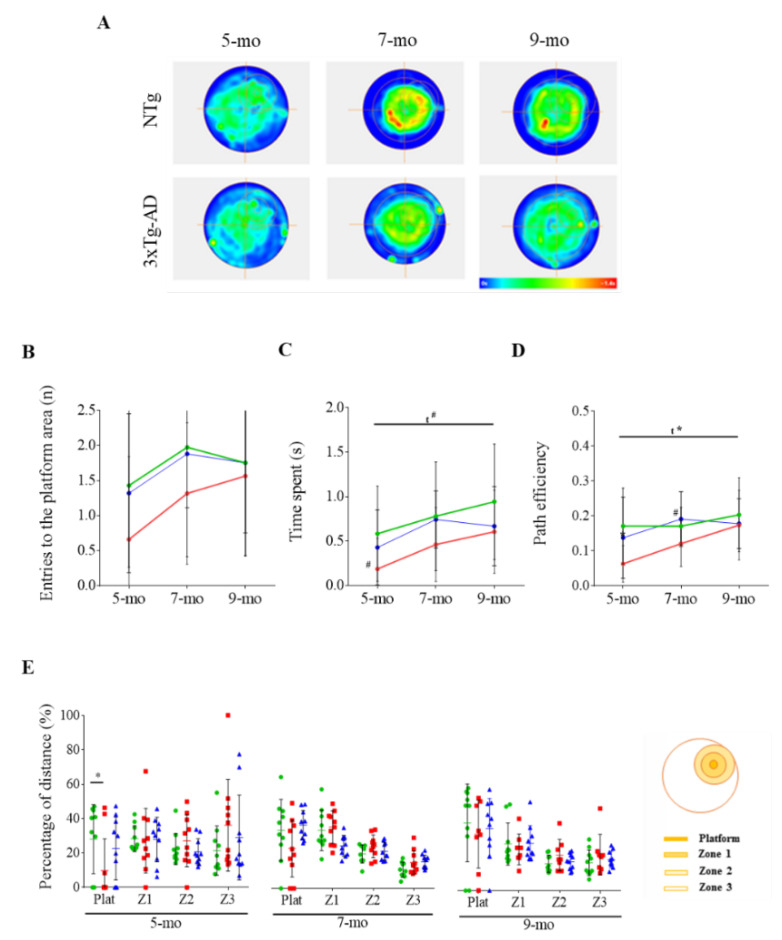
Figure 5.
Long-term memory as assessed by the probe trial in the MWM. (A) Mean heat maps of the 5-, 7- and 9-month-old 3xTg-AD and NTg mice locations. Scale from blue (unoccupied regions) to red (the most occupied regions). (B–D) Evolution of NTg (in green), 3xTg-AD (in red), and scFv-h3D6-treated 3xTg-AD (in blue) mice with age considering (B) the number of entries (n), (C) time spent in the platform zone (s), and (D) path efficiency to the platform zone. (E) Comparative percentage of the distance traveled in each region (platform area, first concentric region (Z1), intermediate region (Z2), and external region (Z3)) between NTg and 3xTg-AD mice. Values are represented by means and error bands correspond to SD. # indicates a low, but not significant, p-value 0.05 < p ≤ 0.1 (Time spent in the platform zone (s), 5-mo, NTg vs. 3xTg-AD-PBS, (t = 1.965, p = 0.0651; Path efficiency, 7-mo, NTg vs. 3xTg-AD-PBS, t = 1.871, p = 0.0778). * significant differences p ≤ 0.05. A refers to NTg mice.

