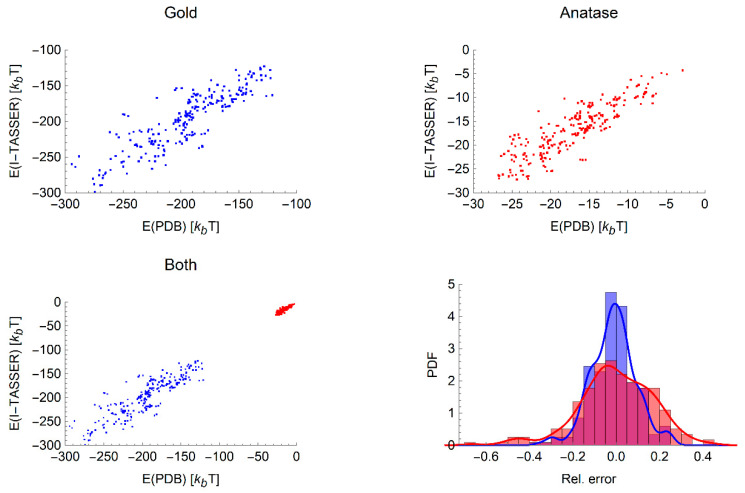
Figure 2.
Comparison between adsorption free energies for the experimentally and computationally derived protein structures, showing all radii simultaneously for gold (top left), anatase (top right) and the combined data sets (bottom left). Bottom right: The sets of relative error of the two materials with blue bars indicating the data for gold and orange for anatase presented as probability density functions (PDF), i.e., normalised counts. A smoothed line (blue for gold, red for anatase) is added to guide the eye and distinguish between overlapping regions.

