Figure 1.
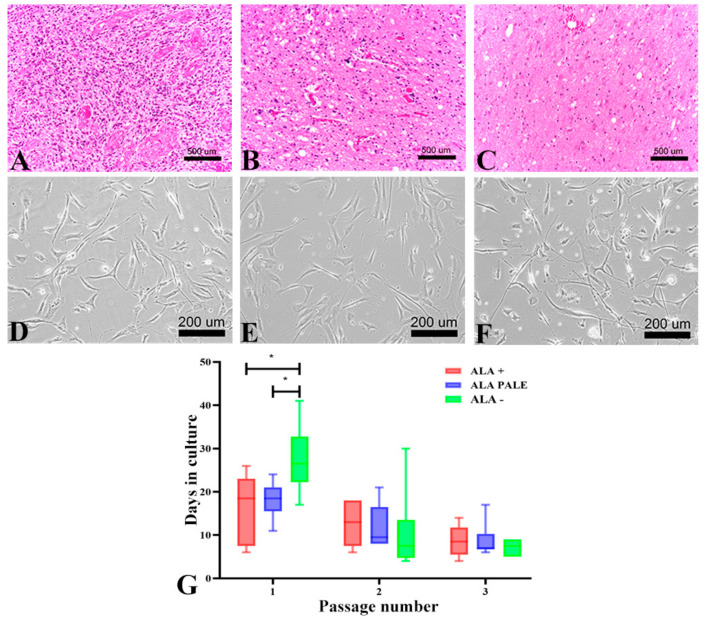
GASC isolated from tumor regions showing different intraoperative 5-ALA fluorescence intensity display different growth kinetics. (A–C) Pictures of HE-stained sections representative of 5-ALA+, 5-ALA PALE and 5-ALA− regions of a newly diagnosed GBM removed by 5-ALA FGS. (A) The 5-ALA+ region displays features of a high-grade tumor (high cell density and mitotic activity, nuclear pleomorphism and necrosis). (B) The 5-ALA PALE section is characterized by a gliotic tissue infiltrated by tumor cells. (C) The 5-ALA− section consists of brain tissue devoid of cancer cells (D–F) Contrast phase images of GASC isolated from 5-ALA+ (D), 5-ALA PALE (E) and 5-ALA− (F) regions showing, in vitro, a similar fibroblast-like morphology, typical of adult mesenchymal stem cells. (G) The histograms represent the growth kinetic of GASC-ALA+, GASC-ALA PALE and GASC-ALA−, as evaluated at the first, second and third passage in culture. Values were calculated by counting days between passages. Data are presented as interleaved box and whiskers (n = 6). * p value < 0.05. Statistical analysis was performed by a Student’s t-test (GraphPad Prism 8).

