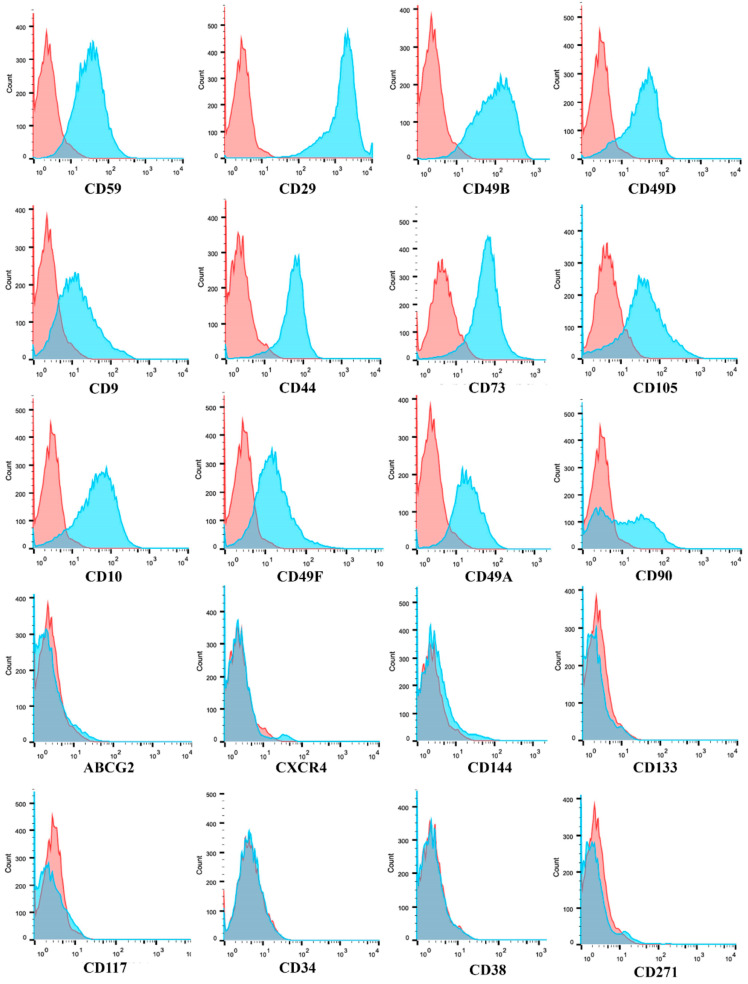
Figure 3.
GASC-ALA+, ALA PALE, ALA− share the same mesenchymal stem cell immunophenotype. Representative histograms of the flow cytometry analysis of GASC cell populations. Histogram overlays show isotype control IgG staining profile (red histogram) versus the specific antibody staining profile (cyan histogram). The expression of twenty surface antigens was evaluated using the flow cytometer FACS CANTO II (BD Biosciences). See Table 1 for quantitative data.

